
Economics and Usage of Digital Libraries: Byting the Bullet
Skip other details (including permanent urls, DOI, citation information): This work is protected by copyright and may be linked to without seeking permission. Permission must be received for subsequent distribution in print or electronically. Please contact mpub-help@umich.edu for more information.
For more information, read Michigan Publishing's access and usage policy.
II. Pricing Electronic Access to Knowledge: The PEAK Experiment
Section Introduction: Pricing Electronic Access to Knowledge (The PEAK Experiment)
The PEAK experiment (Pricing Electronic Access to Knowledge) grew out of Elsevier Science's TULIP (The University Licensing Program) project, an early effort to understand the requirements for providing access to electronic journals. Between 1991 and 1995, nine university libraries participated in TULIP. Coinciding with the birth of the World Wide Web, the project caught the wave of building excitement for the Internet and Web applications. TULIP, however, had a limited focus. Its primary achievement lay in working through technical requirements to deliver digital facsimiles of print journals. Each participant institution created a local implementation and engaged users in the study, yet the project barely scratched the surface of issues associated with emerging user preferences and behavior. TULIP also fell short of original goals to address pricing models for electronic products.
As a successor to TULIP, PEAK picked up where TULIP left off in tackling economic and user issues. The project coalesced critical expertise at the University of Michigan: the expertise of librarians and technologists deeply engaged in early digital library development as well as research expertise from the School of Information's program in Information Economics, Management and Policy. The context in which PEAK took shape presented an extraordinary convergence of trends. Universities along with other large research organizations were grappling with early requirements of network infrastructure and core applications. The Web catalyzed significant interest, yet the rate of adoption and participation was uneven, often due to barriers within the institution. Libraries, comfortable with the successes of online catalogs and networked indices, were suddenly faced with new full text products but had relatively little relevant experience to help guide the associated publisher negotiations. PEAK unfolded concurrently with these critical developments of institutional, library, and publisher infrastructure for digital resources.
In her chapter, Karen Hunter captures the transformation underway in publishing in the mid-1990's. Early pricing proposals conjoined print and electronic pricing (e.g., print and electronic journal packages at 135% of print cost) and were conceived to sustain institutional spending levels during the transition from print to digital delivery. The industry's sales force was experiencing the teething stages of licensing, and publishers were pressured to re-conceive approaches to the library marketplace. New questions about functionality, license terms, and sustainability were added to the library's existing concerns about escalating costs.
The environment of technology development at the University of Michigan provided a rich context for PEAK. Yet, as Bonn et. al. describe in their chapter, the project presented a series of challenges as Elsevier's production processes evolved and as PEAK's research protocols shaped the necessary system design. In the end, PEAK delivered some 1200 journals to 12 institutions while also creating an experimental context in which distinct subscription models could be explored.
In retrospect, many of the lessons learned from PEAK seem obvious. PEAK shed light on the foundational requirements for institutional technology infrastructure. Pervasive network connectivity and robust authentication are now taken for granted. PEAK data also highlighted potentially useful attributes for electronic journal services. User behavior suggested a benefit of access to comprehensive collections, enabling use beyond known print title preferences. Obstacles to use, however small (e.g., the necessity of entering a user name and password), were found to have real impact. Not surprisingly, user-pay models were viewed as less than desirable by librarians and individual users alike. Analysis by PEAK's research team also suggested that the library's intermediary role between publisher and constituents may temper the direct market effects of user behavior.
Gazzale and MacKie-Mason detail the research design behind PEAK's journal price models. The novel concept of generalized subscriptions addressed the desire among libraries for ownership of collections, while unbundling the convention of journal volumes and issues. The generalized model offered the opportunity for pre-payment for articles (at a higher price than traditional subscriptions) and development of institution-specific, customized archives of journal content based on user selections. Some would argue that the capability to search a large body of journals and to extract desired articles for local ownership was a model ahead of its time in offering a flexible alternative to traditional subscriptions. Today, we see a growing number of customizable services for digital content.
PEAK's experimental design was groundbreaking in several respects. PEAK provided a context in which publisher price models could be controlled and manipulated for participant institutions. In its role, the University of Michigan took on the development, marketing, and management of a full-blown journal service for over 340,000 users. Elsevier Science provided content and also accepted the necessary distance from the research design to ensure the integrity of the experimental protocol. This type of collaboration and field research is a rarity.
PEAK was perhaps unique in exploring the interaction of publisher, institutional (library), and user interests. Since PEAK, few (if any) opportunities have emerged to take such a holistic approach.
4. The PEAK Project: A Field Experiment in Pricing and Usage of a Digital Collection
Electronic access to scholarly journals is now an important and commonly accepted tool for researchers. The user community has become more familiar with the medium over time and has started to actively bid for alternative forms of access. Technological improvements in communication networks, paired with decreasing costs of hardware, create greater incentives for innovation. Consequently, although publishers and libraries face a number of challenges, they also have promising new opportunities.[1] Publishers are creating many new electronic-only journals on the Internet, while also developing and deploying electronic access to literature traditionally distributed on paper. They are modifying traditional pricing schemes and content bundles, and creating new schemes to take advantage of the characteristics of digital duplication and distribution.
From 1997 to 1999, researchers in economics at the University of Michigan worked in collaboration with the University of Michigan Library to design and run a project called Pricing Electronic Access to Knowledge (PEAK). This project was both a production service for electronic journal delivery and an opportunity for experimental pricing research that provided access to the more than 1,100 journals then published by Elsevier Science—-journals that include much of the leading research in the physical, life and social sciences. The project provided an opportunity for universities and other research institutions to have electronic access to a large number of journals. This access provided fast and sophisticated searching, nearly instantaneous document delivery, and new possibilities for subscriptions. The University of Michigan Library Digital Library Production Service (DLPS) provided a host service consisting of roughly three and a half years of content (January 1995—June 1999) of the Elsevier Science scholarly journals. Participating institutions had access to this content for over 18 months, after which the project ended and access through our system ceased. Michigan provided Internet-based delivery to over 340,000 authorized users at twelve campuses and commercial research facilities across the U.S. On top of this production system we implemented a field trial in electronic access pricing and usage.
Our primary experimental objective was to learn how additional value can be extracted from existing content by means of innovative electronic product offerings and pricing schemes. We sought to determine how users respond to different pricing schemes and to assess the additional value created from different product offerings. We also analyzed the impact of the different pricing schemes on producer revenues. To a limited extent, we think our results generalize to various business models, customer populations and information goods. Finally, we compared our empirical results with the current conclusions of the economic literature on bundling of information goods.
4.1 PEAK in context: Electronic journal publishing and the University of Michigan Library
The scholarly journal has a tradition of purpose and structure dating back several centuries, with little change. Despite the combined effects of price inflation and fluctuations of currency exchange that libraries weathered in the 1970's and 1980's, the basic construct of journals and subscriptions remained stable and, in fact, the journal has continued to flourish in a world of scholarly publishing that is increasingly global and conglomerate. In contrast to this tradition-laden history, the rapid change stimulated by information technologies in the 1990's was remarkable and unprecedented.
Early efforts to harness the potential of digital technology for journals focused primarily on distribution and access. A far more gradual and separate process of re-engineering editorial review and production processes emerged somewhat later. Major publishers undertook an array of projects with heightened activity evident at the dawn of the Web. Efforts such as Springer Verlag's Red Sage project and Elsevier Sciences' TULIP (The University LIcensing Program) initiative broke ground in testing the limits of Internet distribution and catalyzing the development of more robust access systems. TULIP involved nine institutions and addressed a broad set of issues, including both technical and behavioral concerns. The four-year project achieved significant progress, but failed to address issues of economics and pricing for the new electronic media (Elsevier Science, 1996).
In the aftermath of this early experimentation in electronic journal publishing, a number of inter-related issues emerged that stimulated interest in the economic questions surrounding journals and their electronic versions. Nearly every major publisher launched electronic publishing initiatives and, typically, tackled issues of price, product, and market in a manner that extrapolated from print practices. Early pricing models tightly coupled electronic and print subscriptions. Often electronic versions were available as a companion to the print version, at a surcharge of 15% or more. Almost simultaneously, the phenomenon of electronic preprint services emerged. These factors—plus a growing appetite for enhanced journal functionality—have contributed to the heightened interest surrounding pricing and product models for scholarly journals.
The University of Michigan was one of the institutional participants in TULIP, with a joint project team drawing from Engineering, the School of Information and Library Studies (now the School of Information), the Information Technology Division, and the University Library. Michigan was the first site to implement the 43 journals in materials science offered through TULIP and was also the first to move the service to the Web environment. TULIP's outcomes included a far better understanding of the distribution and access issues associated with electronic journals, but also underscored the inadequacy of an experiment offering too few journals to attract users on a regular basis.
The TULIP experience, coupled with an early history of standardized markup language (i.e., SGML) development in the 1980's, provided a unique environment for digital library development and contributed to Michigan's selection as a technology service provider for the Mellon Foundation-funded JSTOR project (Guthrie, this volume, 1997). The unique organizational collaboration begun with TULIP was expanded in 1993 and institutionalized in a campus-wide digital library program that today encompasses a full production service and development capability (Lougee, 1998). Within this new program the TULIP legacy was pursued with an eye toward better understanding the value, price, and product for electronic journals.
In 1996, an agreement was reached with Elsevier Science to launch PEAK in an attempt to address issues left outstanding in the TULIP process. Through PEAK, Michigan hoped to gain a better understanding of large-scale management of electronic journals through the development of production systems and processes to accommodate the large body of content published by Elsevier Science. While this goal was important, PEAK also provided a large-scale testbed in which to explore issues of pricing and product design for electronic journals.
4.2 Issues guiding the design of PEAK
Information goods such as electronic journals have two defining characteristics. The first and most important is low marginal (incremental) cost. Once the content is transformed into a digital format, the information can be repackaged and distributed at almost zero cost. Nevertheless, the second feature is that information goods often involve high fixed ("first copy") costs of production. A production facility and distribution server must be in place in order to take advantage of the low costs of distribution. For a typical scholarly journal, most of the cost to be recovered by the producer is fixed.[2] The same is true for both publisher and distributor in an electronic access environment. With the cost of electronic "printing and postage" essentially zero, nearly all of the distribution cost consists of system costs for hardware, administration, database creation and maintenance—all costs that must be incurred whether there are two or two million users. Our experience with PEAK bears this out: the only significant variable operating cost was the service of the user support team who answered questions from individual users—a small part of the total cost of providing the PEAK service.
Electronic access offers new opportunities to create and extract value from scholarly literature. This additional value can benefit readers, libraries, distributors and publishers. For distributors and publishers, additional value can help to recover the high fixed costs. Increased value can be created through the production of new products and services (such as early notification services and bibliographic hyperlinking). Additional value that already exists in current content can also be delivered to users and, in part, extracted by publishers through new product bundling and nonlinear pricing schemes that become possible with electronic distribution. For example, journal content can be unbundled and then rebundled in many different ways. Bundling enables the generation of additional value from existing content by targeting a variety of product packages for customers who value the existing content differently. For example, most four-year colleges subscribe to only a small fraction of Elsevier titles. With innovative electronic bundling options, this and other less-served populations may be able to access additional content.
4.3 System design and implementation
Our research team worked with the University Library to design an online system and market this system to a variety of information clients. We primarily targeted libraries, focusing on academic and corporate libraries. Contacts were made with institutions expressing interest and institutions already invested in digital library activity. Over thirty institutions were contacted as potential participants, of which twelve agreed to join the effort. Decisions not to participate were frequently driven by budget limitations, or by the absence of pricing options of interest to the institution.[3] The resulting mix of institutions were diverse in size and information technology infrastructure, as well as in organizational mission. PEAK participants were the University of Michigan, the University of Minnesota, Indiana University, Texas A & M, Lehigh University, Michigan Technological University, Vanderbilt, Drexel, Philadelphia College of Osteopathic Medicine, University of the Sciences in Philadelphia, Dow Chemical, and Warner-Lambert (now part of Pfizer Pharmaceuticals).
The PEAK system provided full-text search of and retrieval from the entire body of Elsevier content for the duration of the experiment, including some content from earlier years that Elsevier provided to help establish a critical mass of content. Several search and browse options were available to users, including mechanisms that limited searches to discipline-specific categories designed and assigned by librarians at the University of Michigan. Any authorized user could search the system, view abstracts, and have access to all free content (see below). Access to "full-length articles" (a designation assigned by Elsevier) depended on the user's institutional subscription package. With this access, articles could be viewed on screen or printed.
The delivery and management of such a large body of content (over 11,000,000 pages at the conclusion of the experiment) and the support of the PEAK experiment required a considerable commitment of both system and human resources. In addition to the actual delivery of content, project staff were responsible for managing the authentication mechanisms, collecting and extracting statistics, and providing user support for, potentially, tens of thousands of users.
PEAK ran primarily on a Sun E3000 with four processors, and was stored on several different configurations of RAID (redundant, fast access drive systems). User authentication and subscription/purchase information was handled by a subsidiary Sun UltraSparc.
Searching was conducted primarily with a locally-developed search engine called FTL (Faster Than Light). Bibliographic search used the OpenText search engine. The authentication/authorization server ran Oracle to manage user and subscription information. Several other types of software came into play with use of the system. They included
Cartesian Inc.'s compression software, CPC, which allowed us to regain a significant amount of disk space through compression of the TIFF images;
Tif2gif software developed at the University of Michigan, which converted images stored in CPC to GIFs;
CPC, printps (for generating Postscript), and Adobe Distiller, which were used in combination to deliver images to users as PDF files; and
The Stronghold web server, which provided SSL encryption for the security of user information.
Project staff at the University of Michigan Digital Library Production Service (DLPS) wrote middleware to manage the interoperation of the tools discussed above.
Designing and maintaining the PEAK system, as well as providing user support and service for the participant institutions, required significant staff resources. Once the system was specified by the research staff, design and maintenance of the system were undertaken by a senior programmer working close to full time in collaboration with a DLPS interface specialist. DLPS programming staff contributed as needed, and the head of DLPS provided management. A full time programmer provided PEAK database support, collecting statistics for the research team and the participants, as well as maintaining the database of authorized users and the transaction database. Two librarians provided about one full-time equivalent of user support (one was responsible for the remote sites, the other for the University of Michigan community). Other UM library staff put in considerable time during the setup phases of PEAK to market the service to potential participants, some of whom required substantial education about the methods and aims of the experiment, and to formalize the licensing agreements with participants.
In order to facilitate per-article purchases, PEAK also needed to have the capacity to accept and process credit card charges. In the early months of the service, this billing was handled by First Virtual, a third-party electronic commerce company. This commercial provider also verified the legitimacy of users and issued virtual PINs that were to be used as passwords for the PEAK system. Less than half way through the PEAK experiment, First Virtual restructured and no longer offered these services. At that point, DLPS took over the processing of applications and passwords. Credit card operations were transferred to the University of Michigan Press.
We designed the system to support the planned research as well as to serve the daily information needs of a large and varied user community. Accommodating both purposes introduced a number of complexities. We sought to balance conflicting demands and to adhere to some fundamental goals:
Providing meaningful intellectual access via a Web interface to a very large body of content.
Balancing the aims of the research team with the library's commitment to making the content as easily accessible as possible.
Enabling and supporting a number of different transaction types, taking into account that not all users have access to all types of transactions and that the suite of transaction choices may change over time, depending on the manipulation of experimental conditions.
Enabling and supporting a number of different access levels, based on whether the user authenticates by password, the location of the user, the date of the material, and the type of material (e.g., full-length articles vs. other materials).
Tensions were exacerbated by our reliance on content from just one large commercial publisher and by the specific requirements for the research experiments. John Price-Wilkin, Head of DLPS, compared the production system problems to those of a standard service (Price-Wilkin, 1999):
The research model further complicates these methods for access, where all methods for access are not available to all institutions, and not all institutions choose to take advantage of all methods available to them. This creates a complex matrix of users and materials, a matrix that must be available and reliable for the system to function properly. Independence from Elsevier was critical in order for us to be able to test these models, and the body of Elsevier materials was equally important to ensure that users would have a valuable body of materials that would draw them into the research environment. The ultimate control and flexibility of the local production environment allowed the University of Michigan to perform research that would probably not have otherwise been possible, or could not have been performed in ways that the researcher stipulated.
4.4 Economic and experimental design
The PEAK system built upon existing digital library infrastructure and information retrieval mechanisms described above, but its primary purpose was to serve as a testbed for economic experiments in pricing and bundling information goods. Central to the PEAK experiment were the opportunities that electronic access creates for unbundling and re-bundling scholarly literature. A print-on-paper journal is, in itself, a bundle of issues. Each issue contains a bundle of articles, each of which is again a bundle of bibliographic information, an abstract, references, text, figures and many other elements.[4] In addition, the electronic environment makes possible other new dimensions of product variations. For example, access can be granted for a limited period of time (e.g., day, month, and year) and new services such as hyperlinks can be incorporated as part of the content. Permutations and combinations are almost limitless.[5]
Choosing what to offer from the different bundling alternatives is not an easy task. In the PEAK experiment, we were constrained by the demands of the experiment and the demands of the customers. Given the limited number of participants, bundle alternatives had to be limited in order to obtain enough experimental variation to support statistical analysis. The products had to be familiar enough to potential users to generate participation and reduce confounding learning effects. The economic models were designed by the University of Michigan research team, then reviewed and approved by a joint advisory board comprised of two senior Elsevier staff members (Karen Hunter and Roland Dietz), the University of Michigan Library Associate Director for Digital Library Initiatives (Wendy Pradt Lougee), and the head of the research team (Professor Jeffrey MacKie-Mason).
After balancing the different alternatives and constraints, we selected three different bundle types as the products for the experiment. We refer to the product types as traditional subscriptions, generalized subscriptions and single articles (sometimes called the "per-article" model).[6] We now describe these three product offerings.
Traditional subscription: A user or a library could purchase unlimited access to a set of articles designated as a journal by the publisher for $4/issue if the library already held a print subscription. The value-based logic supporting this model is that the content value is already paid in the print subscription price, so the customer is only charged for an incremental electronic delivery cost. If the institution was not previously subscribed to the paper version, the cost of the traditional subscription was $4 per issue, plus 10% of the paper version subscription price. In this case, the customer is charged for the electronic delivery cost plus a percentage of the paper subscription price to reflect the value of the content. The electronic journals corresponded to the Elsevier print-on-paper journal titles. Access to subscribed content continued throughout the project. The traditional subscription is a "seller-chooses" bundle, in that the seller, through the editorial process, determines which articles are delivered to subscribed users.
Generalized subscription: An institution (typically with the library acting as agent) could pre-purchase unlimited access to a set of any 120 articles selected by users. These pre-purchases cost $548 for the bundle, which averages about $4.50 per article selected. This is a "user-chooses" bundle. With a generalized subscription, the user selected which articles were accessed, from across all Elsevier titles, after the user had subscribed. Once purchased the article was available to anyone in that user community.
Per-article: A user could purchase unlimited access to a specific article for $7/article. This option was designed to closely mimic a traditional document delivery or interlibrary loan (ILL) product. With ILL the individual usually receives a printed copy of the article that can be retained indefinitely. This is different from the "per-use" pricing model often applied to electronic data sources. The article was retained on the PEAK server, but the user could access a paid-for article as often as desired. This was a "buyer-chooses" scheme, in that the buyer selected the articles purchased.
The per-article and generalized subscription options allowed users to capture value from the entire corpus of articles without having to subscribe to all of the journal titles. Once the content is created and added to the server database and the distribution system is constructed, the incremental cost of delivery is approximately zero. Therefore, to create maximal value from the content, it is important that as many users as possible have access. The design of the price and bundling schemes affected both how much value was delivered from the content (the number of readers), and how that value was shared between the users and the publisher.
Institutional generalized subscriptions may be thought of as a way to pre-pay for individual document delivery requests. One advantage of generalized subscription purchases for both libraries and individuals is that the "tokens" cost substantially less per article than the per article license price. By predicting in advance how many tokens would be used (and thus bearing some risk), the library could essentially pre-pay for document delivery at a reduced rate. However, unlike commercial document delivery or an interlibrary loan, all users within the community have ongoing unlimited access to the articles obtained with generalized subscription tokens. Thus, for the user community, a generalized subscription combines features of both document delivery (individual article purchase on demand) and traditional subscriptions (ongoing shared access). One advantage to a publisher is that generalized subscriptions represent a committed flow of revenue at the beginning of each year, and thus shift some of the risk for usage (and revenue) variation onto the users. Another is that they allow access to the entire body of content to all users and, by thus increasing user value from the content, provide an opportunity to obtain greater returns from the publication of that content.
A simplified example illustrates why a library might spend more purchasing generalized subscriptions than traditional subscriptions. Consider a traditional subscription with 120 seller-specified articles, selling for $120, and a generalized subscription that allows readers to select 120 articles from the larger corpus, also for $120. Suppose that in the traditional subscription, users get zero value from half of the articles, but something positive from the other half. Then, the library is essentially paying $2 per article for which users have positive value. In this example, a cost-benefit oriented library would only purchase traditional subscriptions as long as the average value for the articles users want is at least $2 each. In a generalized subscription, however, users select articles that they actually value (they are not burdened with unwanted articles), so the average cost is $1 per article the user actually wants to read. The library then might justify a budget that continues buying generalized subscriptions to obtain the additional articles that are worth more than $1 but less than $2 to users. The result is more articles and more publisher revenue than with traditional subscriptions. Of course, the library decision process is more complicated than this, but the basic principle is that users get more value for the dollar spent when they—not the sellers—select the articles to include, and thus, since additional spending creates more user value wth the generalized subscription, over time the library might spend more.
The twelve institutions participating in PEAK were assigned randomly to one of three groups, representing three different experimental treatments, which we labeled the Greeen, Blue and Red groups. Users in every group could purchase articles on a per-article basis. In the Green group they could also purchase institutional generalized subscriptions; in the Blue group they could purchase traditional subscriptions; in the Red group they could purchase both traditional and generalized subscriptions in addition to individual articles.
Regardless of treatment group, access was further determined by whether the user had logged in with a PEAK password. Use of a password allowed access from any computer (rather than only those with authorized IP addresses) and, when appropriate, allowed the user to utilize a generalized subscription token. The password authorization protected institutions from excessive usage of pre-paid generalized subscription tokens by walk-in users at public workstations. The password was also required to purchase articles on a per-article basis (to secure the financial transaction) and to view previously purchased articles (to provide some protection to the publisher against widespread network access by users outside the institution).
The password mechanism was also useful for collecting research data. Usage sessions were of two types: those authenticated with a PEAK password and those not. For unauthenticated sessions, the system recorded which IP addresses accessed which articles from which journal titles. When users employed their PEAK passwords, the system recorded which specific users accessed which articles. Uses that resulted in full-article accesses were also classified according to which product type was used to pay for access. Because we recorded all interface communications, we were able to measure complex "transactions". For example, if a user requesting an article (i.e., clicked on its link) was informed that the article was not available in the (traditional or generalized) subscription base, we could distinguish between whether the user chose to pay for the article on a per article basis or decided to forego access.
An important consideration for both the design and analysis of the experiment was the possibility of learning effects during the life of the project. If present, learning makes it more difficult to generalize results. We expected significant learning about the availability and use of the system due to the novelty of the offered products and the lack of user experience with electronic access to scholarly journals. To decrease the impact of learning effects, we worked with participating institutions to actively educate users about the products and pricing prior to implementing the service. Data were also collected for almost two years, which enabled us to isolate some of the learning effects.
To test institutional choices (whether to purchase traditional or generalized subscriptions, and how many), we needed participation from several institutions. Further, to explore the extent to which electronic access and various price systems would increase content usage, we needed a diverse group of potential (individual) users. Therefore, we marketed the project to a diverse group of institutions: four-year colleges, research universities, specialized research schools, and corporate research libraries. A large user community clearly improved the breadth of the data, but also introduced other complications. For example, user behavior might be conditioned by the characteristics of the participating institutions (such as characteristics of the institution's library system, availability of other electronic access products, institutional willingness to reimburse per-article purchases, etc.).
4.5 Pricing
Pricing electronic access to scholarly information is far from being a well-understood problem. Contemporaneous with the PEAK experiment, Prior (1999) reported that, based on a survey of 37 publishers, when both print-on-paper and electronic versions were offered 62% of the publishers had a single combined price, with a surcharge over the paper subscription price of between 8% and 65%. The most common surcharge was between 15% and 20%. Half of the respondents offered electronic access separately at a price between 65% and 150% of print, most commonly between 90% and 100%. Fully 30% of the participating publishers changed their pricing policy in just one year (1999). In this section, we will describe the pricing structure we implemented in the PEAK experiment and our rationale for it.
For content that can be delivered either on paper or electronically, there are three primary cost categories: content cost, paper delivery cost and electronic delivery costs. The price levels chosen for the experiment reflect the components of cost, adjusted downward for an overall discount to encourage participation in the experiment.[7]
To recover the costs of constructing and operating the electronic delivery system, participating institutions paid the University of Michigan an individually negotiated institutional participation license (IPL) fee, roughly proportional to the number of authorized users. To account for the content cost, institutions or individual users paid the access prices associated with each product type described above (traditional subscriptions, generalized subscriptions, or individual articles)
Arbitrage possibilities impose some constraints on the relative prices between access options. Arbitrage arises when users can choose different options to replicate the same access. For example, the PEAK price per article in a per-article purchase had to be greater than the price per article in a generalized subscription, and this price had to be greater than the price per article in a traditional subscription. These inequalities impose the restriction that the user could not save by replicating a traditional subscription through purchasing individual articles or a generalized subscription, nor save by replicating a generalized subscription by paying for individual articles. Alternatively, arbitrage constrains publishers to charge a price for bundles that is less than the sum of the individual component prices.
The mapping of component costs to price levels is not exact, and in some cases the relationship is complicated. For example, although electronic delivery costs are essentially zero, there is some additional cost to creating the electronic versions of the content (especially at the time of the PEAK experiment because Elsevier's current production process was not fully unified for print and electronic publication). Therefore, the electronic access price might be set in a competitive market to recover both the content value and also some amount of incremental electronic delivery cost.
Based on the considerations above, and on negotiations with the publisher, we set the following prices: per article at $7; generalized subscriptions at $548 for 120 articles; and traditional subscriptions at $4 per issue plus 10% of the paper subscription price. A substantial amount of material, including all content available that was published two calendar years prior, was available without any additional charge after an institution paid the IPL fee for the service. We refer to this as "unmetered". Full-length articles from the current two calendar years were "metered": users could access them only if the articles were paid for under a traditional or generalized subscription, or purchased on a per-article basis.
4.6 Results
In this section we report some descriptive results from both the experiment and the production service. See Gazzale and MacKie-Mason (this volume) for a more detailed study of the economic experiment results.
Revenues and costs
In Table 4.1 we summarize PEAK revenues. The actual total was over $580,000 (the sum of total revenue in the first two rows).[8] The first and third rows report annual revenues, with 1999 adjusted to reflect an estimate of what revenues would have been if the service were to run for the full year (it ended in August 1999, but only six months of content were included, and prices were adjusted accordingly). On an annualized basis, two-year revenues were about $712,000.
Between the first and second year of the service, the number of traditional subscriptions substantially decreased: this occurred because two schools cancelled all of their (electronic) subscriptions. By reducing the number of journal titles under traditional subscription, the users of these libraries needed to rely more heavily on the availability of unused generalized subscription tokens, or they had to pay the per-article fee. We see from the table that the annualized revenues for per-article purchasing are seventeen times higher in 1999 than in 1998, and that the 1999 generalized subscription revenues (annualized) are 8% lower than in 1997-1998.
A full calculation of the costs of supporting the PEAK service is difficult, given the mix and dynamic nature of costs (e.g., hardware). We estimate that total expenditures by the University of Michigan were nearly $400,000 during the 18 month life of the project. Of this cost, roughly 35% was expended on technical infrastructure and 55% on staff support (i.e., system development and maintenance, data loading, user support, authentication/authorization/security, project management). Participant institution (IPL) fees covered approximately 45% of the project costs, with vendor and campus in-kind contributions covering another 20-25%.[9] The UM Digital Library Production Service contributed resources to this effort, reflecting the University of Michigan's desire to provide this service to its community, and also its support for the research.
| Traditional Subscriptions | Generalized Subscriptions | Individual Articles | Total Access | IPL**** | Total | ||||
| Year | Quantity | Revenue | Quantity | Revenue | Quantity | Revenue | Revenue | Revenue | Revenue |
| 1997-1998 | 1939 | $216,018 | 151 | $82,748 | 275 | $1,929 | $300,691 | $140,000 | $440,691 |
| 1999* | 1277 | $33,608 | 92 | $50,416 | 3186 | $22,302 | $106,326 | $42,000 | $148,326 |
| Annualized 1999** | 1277 | $78,996 | 138 | $75,624 | 4779 | $33,453 | $188,073 | $84,000 | $272,073 |
| Total 1997-1999*** | 3216 | $295,014 | 289 | $158,372 | 5054 | $35,378 | $488,764 | $224,000 | $712,764 |
4.7 User demographics
In the PEAK project design, unmetered articles and articles covered by traditional subscriptions could be accessed by any user from a workstation associated with one of the participating sites (authenticated by the computer's IP address). If users wanted to use generalized subscription tokens or to purchase individual articles on a per-article basis they had to obtain a password and use it to authenticate.[10] We have more complete data on the subset of users who obtained and used passwords.
| Status | ||||||
| Division | Faculty | Staff | Graduate Student | Undergrad | Other | Total |
| Engineering, science and medicine | 408 | 214 | 1032 | 211 | 38 | 1903 |
| Architecture and urban planning | 103 | 11 | 47 | 16 | 19 | 196 |
| Education, business, information/library science and social science | 91 | 43 | 287 | 46 | 2 | 469 |
| Other | 178 | 240 | 350 | 176 | 34 | 978 |
| Total | 780 | 508 | 1716 | 449 | 93 | 3546 |
In Table 4.2 we report the distribution of the more than three thousand users who obtained passwords and who used PEAK at least once. Most of the users are from engineering, science and medicine, reflecting the strength of the Elsevier collection in these disciplines. 70% of these users were either faculty or graduate students (see Figure 4.1). The relative fractions of faculty and graduate students varies widely by discipline (see Figure 4.2). Our sample of password-authenticated users, while probably not representative of all electronic access usage, includes all those who accessed articles via either generalized subscription tokens or per-article purchase. It represents the interested group of users, who were sufficiently motivated to obtain and use a password. Gazzale and MacKie-Mason (this volume) discuss the effects of passwords and other user costs on user behavior.
 Figure 4.1: Distribution of users who obtained passwords and used them to access PEAK
 Figure 4.2: Users with Passwords Who Accessed PEAK
In Table 4.3 we summarize usage of PEAK through August 1999. Authorized users joined the system gradually over the first nine months of 1998. There were 208,104 different accesses to the content in the PEAK system over 17 months.[11] Of these, 65% were accesses of unmetered material (not-full-length articles, plus all 1998 accesses to content published pre-1997, and all 1999 accesses to pre-1998 content).[12] However, one should not leap to the conclusion that users will access scholarly material much less when they have to pay for it, though surely that is true to some degree. To correctly interpret the "free" versus "paid" accesses we need to account for three effects. First, to users much of the metered content appeared to be free: the libraries paid for the traditional subscriptions and the generalized subscription tokens. Second, the quantity of unmetered content in PEAK was substantial: on day one, approximately January 1, 1998, all 1996 content and some 1997 content was in this category. On January 1, 1999, all 1996 and 1997 content and some 1998 content was in this category. Third, the nature of some unmetered content (for example, letters and announcements) is different from metered articles, which might also contribute to usage differences.
| Treatment group | ||||
| Access Type | Green | Red | Blue | All Groups |
| Unmetered | 24632 | 96658 | 13911 | 135201 |
| Traditional subscription articles | ||||
| 1st use | N/A | 27140 | 2881 | 30021 |
| 2nd or higher use | N/A | 11914 | 597 | 12511 |
| Generalized subscription articles | ||||
| 1st use | 8922 | 9467 | N/A | 18389 |
| 2nd or higher use | 3535 | 4789 | N/A | 8324 |
| Individually purchased articles | ||||
| 1st use | 194 | 75 | 3192 | 3461 |
| 2nd or higher use | 108 | 26 | 63 | 197 |
| Total accesses | 37391 | 150069 | 20644 | 208104 |
Generalized subscription "tokens" were used to purchase access to 18,389 specific articles ("1st use"). These articles were then distinctly accessed an additional 8,324 times ("2nd or higher use"), for an average of 1.45 accesses per generalized subscription article. Traditional subscription articles had an average of 1.42 accesses per article. A total of 3461 articles were purchased individually on a per-article basis; these were accessed 1.06 times per-article on average. The difference in the number of accesses per article for articles obtained by generalized subscription and by per-article purchase is likely due to the difference in who may access the article after initial purchase. All authorized users at a site could access an article once it has been purchased with a generalized subscription token, while only the individual making a per-article purchase has the ability to re-access that article. Thus, we estimate that for individually purchased articles (whether by generalized subscription token or per-article purchase), the initial reader accessed the articles 1.06 times, and additional readers accessed these articles 0.39 times. That is, there appears on average at least one-third additional user per article under the more lenient access provisions of a generalized subscription token.
 Figure 4.3: Concentration of article accesses across different journal titles
In Figure 4.3 we show a curve that reveals the concentration of usage among a relatively small number of Elsevier titles. We sorted articles that were accessed from high to low in terms of how often they were accessed. We then determined the smallest number of articles that, together, comprised a given percentage of total accesses, and counted the number of journal titles from which these articles were drawn. For example, 37% of the 1200 Elsevier titles generated 80% of the total accesses. 40% of the total accesses were accounted for by only about 10% of the journal titles.
 Figure 4.4: Percentage of model used by experimental group: Jan 1998-Aug 1999
In Figure 4.4 we compare the fraction of accesses within each treatment group that are accounted for by traditional subscriptions, generalized subscriptions and per-article purchases. Recall that the Green and Blue groups only had two of the three access options.[13] When institutions had the choice of purchasing generalized subscription tokens, their users purchased essentially no access on a per-article basis. Of course, this makes sense as long as tokens are available: it costs the users nothing to use a token, but it costs real money to purchase on a per-article basis. Indeed, our data indicate that institutions that could purchase generalized subscription tokens tended to purchase more than enough to cover all of the demand for articles by their users; i.e., they didn't run out of tokens in 1998. We show this in aggregate in Figure 4.5: only about 50% of the tokens purchased for 1998 were in fact used. Institutions that did not run out of tokens in 1999 appear to have done a better job of forecasting their token demand for the year (78% of the tokens purchased for 1999 were used). Institutions that ran out of tokens used about 80% of the tokens available by around the beginning of May.
 Figure 4.5: Percentage of pre-paid tokens used as a percentage of time available
Articles in the unmetered category constituted about 65% of use across all three groups, regardless of which combination or quantity of traditional and generalized subscriptions an institution purchased. The remaining 35% of use was paid for with a different mix of options depending on the choices available to the institution. Evidently, none of the priced options choked off use altogether.
 Figure 4.6: Total accesses per potential user: Jan 1998-August 1999
We show the total number of accesses per potential user for 1998 and 1999 in Figure 4.6. We divide by potential users (the number of people authorized to use the computer network at each of the participating institutions) because different institutions joined the experiment at different times. This figure thus gives us an estimate of learning and seasonality effects in usage. Usage per potential user was relatively low and stable for the first 9 months. However, it then increased to a level nearly three times as high over the next 9 months. We expect that this increase was due to more users learning about the existence of PEAK and becoming accustomed to using it. Note also that the growth begins in September 1998, the beginning of a new school year with a natural bulge in demand for scholarly articles. We also see pronounced seasonal effects in usage: local peaks in March, November and April.
To see the learning effect without interference from the seasonal effect, we calculated usage by type of access in the same three months (March-May) of 1998 and 1999; see Table 4.4. Overall, usage increased 167% from the first year to the second.
| 1998 | 1999 | Percentage Change | |
| Unmetered | 19291 | 55745 | 189% |
| Traditional | 6374 | 10560 | 66% |
| 1st Token | 1648 | 4805 | 192% |
| 1st per-article purchase | 1 | 1288 | N/A |
| 2nd or higher Token | 3060 | 8166 | 167% |
| 2nd or higher per-article purchase | 8 | 472 | 5800% |
| Total | 30382 | 81036 | 167% |
We considered the pattern of repeat accesses distributed over time. In Figure 4.7 we show that about 93% of articles accessed were accessed no more than two times. To further study repeat accesses, we selected only those articles (7%) that were accessed three or more times between January 1998 and August 1999 (high use articles). We then counted the number of times they were used in the first month after the initial access, the second month after, and so forth; see Figure 4.8. What we see is that almost all access to even high use articles occurred during the first month. After that, a very low rate of use persisted for about seven more months, then faded out altogether. Thus, we see that, even among the most popular articles, recency was very important.
 Figure 4.7: Percentage of Articles by Number of Times Read
 Figure 4.8: The distribution of usage for high use articles
Although recency appears to be quite important, we saw in Table 4.1 that over 60% of total accesses were for content in the unmetered category, most of which was over one year old. Although we pointed out that the monetary price to users for most non-unmetered articles was still zero (if accessed via institution-paid traditional or generalized subscriptions), there were still higher user costs for much of the more recent usage. If a user wanted to access an article using a generalized subscription token, then she had to obtain a password, remember it (or where she put it) and use it. If the article was not available in a traditional subscription and no tokens were available, then she had to do the above plus pay for the article with hard currency. Therefore, there are real user cost differences between the unmetered and metered content. The fact that usage of the older, unmetered content is so high, despite the clear preference for recency, supports the notion that users respond strongly to costs of accessing scholarly articles.[14]
4.8 Discussion
PEAK was a rather unique project. During a relatively early stage of the transition to digital scholarly collections, we delivered a large-scale production service containing several years of content from over 1100 journal titles, for a total of about 10 million pages. On top of the commitment to a production-quality service we also implemented a field experiment to test usage response to several different pricing and bundling models, one of which (generalized subscriptions) was quite novel. We summarize our most important general conclusions here:
Of the purchasing options we offered, the generalized subscriptions—our innovation—was the most popular and generated the most interest. Libraries saw the generalized subscription as a way of increasing the flexibility of their journal budgets and of tying purchasing more closely to actual use. The generalized subscription provides fast and easy access to articles in demand from the complete corpus, not just from a subscribed subset of titles.
We observed great interest in the monthly statistical reports on local article use that we generated for participating libraries. Participants were eager to use these to help assess current subscription choices and to further understand user behavior.
The user cost of access—comprised not just of monetary payments, but also of time and effort—has a significant effect on the number of articles that readers access. (See Gazzale and MacKie-Mason (this volume) for further detail.)
There was a substantial learning period during which users became aware of the service and accustomed to using it. It appears that usage was increasing even after a year of service. By the end of the experiment, usage was at a rather high level: approximately five articles accessed per month per 100 potential users, with potential users defined broadly (including all undergraduate students, who rarely use scholarly articles directly).
It has long been known that overall readership of scholarly literature is low. We have seen that even the most popular articles are read only a few times, across 12 institutions. We did not, however, measure how often those articles were being read in print versions during the same periods.
Recency is very important: repeat usage dropped off considerably after the first month. (This was also reflected in user comments, not reported above.)
PEAK had a limited life by design, and today most of the major publishers of scholarly journals have implemented their own PEAK-like service. The environment is far from stable, however, and service options, pricing and bundle offerings continue to evolve. Our results bear on the economics and usage of digital collections today and in the future, and provide some support for particular design choices.
Notes
1. See MacKie-Mason and Riveros (2000) for a discussion of the economics of electronic publishing.![]()
2. Odlyzko (1995) estimates that it costs between $900-$8700 to produce a single math article. 70% of the cost is editorial and production, 30% is reproduction and distribution.![]()
3. This assertion and others concerning user preferences are based on our analysis of the ethnographic records compiled during the marketing process by Ann Zimmerman, and the results from a series of user surveys we administered during the project.![]()
4. One pragmatic and unresolved issue for applying bundling models is the treatment of journal content other than articles. Many notices and reviews, as well as editorial content integral to a journal's identity, cannot be categorized as articles. How and when these items are indexed (thus becoming searchable) as well as how they should be priced are still open questions in electronic journal delivery and pricing.![]()
5. See MacKie-Mason and Riveros (2000) for a more complete discussion of the economic design space.![]()
6. All older materials (i.e., pre-1998) were freely available to all project participants, as were bibliographic and full-text searches, with no charges levied for viewing citations, abstracts or non-article material such as reviews and notices. The remaining content (essentially, full-length articles published after 1997) could be purchased through one of the product types.![]()
7. If the scholarly publishing market is competitive, then we expect long-run prices to reflect incremental component costs. Whether this market is competitive is a contentious issue; see McCabe (this volume) for one view on this question.![]()
8. Due to delays in starting the project, the first revenue period covered content from both 1997-98, although access was available only during 1998. For this period, prices for traditional subscriptions were set to equal $6/issue, or 1.5 times the annual price of $4/issue, to adjust for the greater content availability.![]()
9. The University of Michigan production service retained IPL annual participation fees. The publisher received the content charges, minus a modest service fee for the credit card service provided by the University of Michigan Press.![]()
10. Through an onscreen message we encouraged all users to obtain a password and use it every time in order to provide better data for the researchers. From the data, we concluded that only a small fraction apparently chose to obtain passwords based solely on our urging; most who did apparently obtained passwords because they were necessary to access a specific article.![]()
11. We limited our scope to what we call "unique accesses," counting multiple accesses to a given article by a single individual during a PEAK session as only one access. For anonymous access (i.e., access by users not enetering a password), we define a "unique" access as any number of accesses to an article within 30 minutes from a particular IP address. For authenticated users, we define a "unique" access as any number of accesses to an article by an authenticated user within 30 minutes of the first access.![]()
12. See the definition of unmetered material in the text above.![]()
13. Individual article purchase was available to both; Green institutions could also purchase generalized subscriptions, and Blue could purchase traditional subscriptions.![]()
14. In another preliminary test of the impact of user cost on usage, we compared the usage of the Red and Blue groups. Red institutions had both generalized and traditional subscriptions available; Blue had only traditional. We calculated the number of paid articles accessed (paid by generalized tokens or per-article) for each group, after normalizing by the number of traditional subscriptions, and the number of potential users at the institutions. We found that when generalized subscriptions were available, which have a much lower user cost since the library pays for the tokens, three times as many articles were accessed as at institutions which had to pay for each of these articles on a per-article basis. See Gazzale and MacKie-Mason (this volume).![]()
5. PEAK and Elsevier Science
This paper reviews Elsevier Science's participation in the PEAK experiment. Elsevier and the University of Michigan had been partners in the TULIP experiment (1991—95), the first large-scale delivery of journals to university desktops. PEAK was designed by Michigan to address some of the economic questions unresolved by TULIP. Once the design of the experiment was agreed, Elsevier's day-to-day role was limited, but its interest in the outcome of the experiment was high enough to risk participating.
PEAK operated in parallel with Elsevier's own development of local and web-based commercial journal database services. The issues associated with parallel experimentation and commercialization were significant. Pricing policies and product attributes for the commercial offering were developed and implemented at the same time as the PEAK experiment was ongoing. This created points of comparison and potential tension.
This paper reviews Elsevier Science's relation to PEAK and the application at Elsevier of what has been learned from PEAK.
5.1 Pre-PEAK experimentation with the University of Michigan
Starting in the late 1980s, Elsevier Science had been approached by several universities to do experiments with them that would test the delivery of full text to the desktop over campus local-area networks. We had discussions at the Stanford University Medical School, the University of Pennsylvania, Cornell University, and Carnegie Mellon University, among others. In each case, the project would be unique to that university and, while perhaps helpful to the university, would do little to give us a test that would be scaleable or that would provide us with sufficient market data to aid in practical product development. We progressed the farthest with Carnegie Mellon and carried those discussions over into a broader forum — the newly-formed Coalition for Networked Information. At the Spring, 1991, CNI meeting, it was agreed that if ten or fifteen universities would commit to the same basic experiment, then a publisher could justify investing in the creation of a major testbed. Fifteen universities organized a project on the spot and the challenge was on.[1]
Out of this challenge came TULIP — The University LIcensing Program. Ultimately, nine of the initial fifteen universities became a part of TULIP with the other six remaining as observers. The participants were Carnegie Mellon, Cornell, Georgia Tech, MIT, the University of California (all campuses), the University of Michigan, the University of Tennessee, the University of Washington, and Virginia Tech. The experiment went live in January, 1993, and continued through 1995. Elsevier scanned print copies of initially 40 and ultimately 83 materials science journals (starting with the 1992 issues), creating TIFF files with edited, structured ASCII headers and raw OCR-generated ASCII full-text files. By the end of the project, more than 500,000 pages were in the system.
These files were shipped to each university, where they were made available to users via software systems developed at each site. Although there was a technical working group and some of the development was shared among more than one site, essentially each implementation was unique. This was the intent of the project, as the thinking at the time was that each university would want to integrate these journals with other information held on its campus and present it in its own context (e.g., within the Melville system at the University of California, where there was a central host that served all campuses).
There were three basic goals of the TULIP project: (1) to determine the technical feasibility of networked distribution, (2) to study reader usage patterns under different distribution situations, and (3) to understand — through the implementation of prototypes — alternative costing, pricing, subscription and market models that might be viable in electronic journal systems. The project was enormously successful in many ways and an incredible amount was learned, particularly about the technical issues. For example, this was in the very early days of the Internet. Elsevier Science had no Internet server expertise and had to go outside (to Engineering Information, now a part of Elsevier) to be our technical host. Initially, all shipments of files were over the Internet, but this proved unsatisfactory. Not only did we at times account for 5% of Internet traffic (the 4,000 TIFF pages sent every two weeks individually to nine sites was a slow and heavy load), but the logistics on the receiving end did not work well either. In 1994 there was a switch from push to pull shipments from our central server to the campus machines and, finally, in 1995 to delivery on CD-ROM. TULIP also made clear the need for high-speed networks in the links among the University of California campuses.
Mosaic made its appearance in the middle of the project, immediately changing the perspective from unique university installations to a generic model. Indeed, one of the participants — having developed a Unix-based system, only to find the Materials Science department. all used Macs — gave up when Mosaic appeared, as it seemed pointless to convert their Unix system for the Mac when something else was going to move in.
In the end, of the nine implementations, it was fair to say that three were very good, three were more limited but satisfactory, and three never really got underway. The outstanding player was clearly the University of Michigan. They organized their effort with a highly-motivated interdepartmental team, were the first to go live, and put up not one but three implementations. There was a general, relatively low-functionality implementation through MIRLYN (the NOTIS-based OPAC), a much higher-level functionality approach on the College of Engineering's CAEN (Computer-Aided Engineering Network) system; and finally, a web-based approach once the advantages of a web system were clear. Michigan became the TULIP lead site and they graciously showed many visitors their implementation. To some degree Michigan's involvement with JSTOR came out of its TULIP participation, or at least the expertise gained during TULIP.
5.2 From TULIP to PEAK
One of the Elsevier dilemmas during TULIP was what to do when the project ended at the end of 1995. Was there a marketable product here? Had we learned enough about networked delivery of journals to go beyond the limited scope of TULIP? The decision was made in 1994 to scan all 1,100+ Elsevier journals and to launch a commercial version of TULIP called Elsevier Electronic Subscriptions (EES). Michigan became one of the first subscribers when TULIP ended. EES, like TULIP, consisted of files delivered to the campus for local loading and delivery over the campus network.
In designing the transition, Michigan made it clear that there was one thing they were particularly disappointed in with respect to TULIP: namely, that so little was learned about the economics of networked journals. There were many reasons for that — including preoccupation with technical and user behavior issues and reluctance on both sides to take risks — but the reality was that Michigan was correct: we had not gathered the hoped-for economic data. In addition, at this time the number of scholarly journals available in electronic form was slowly growing and the pricing used by publishers could be described at best as experimental. Elsevier, for reasons described below, had introduced and briefly priced its EES product at a combined print and electronic price of 135% of the print. Michigan had concerns about the variability and volatility in the pricing models they were seeing. Therefore, in deciding to proceed with the EES program, Michigan stressed the importance of continuing our experimental relationship, looking specifically at pricing. Out of that discussion came the PEAK (Pricing Electronic Access to Knowledge) experiment.[2]
5.3 PEAK design
Unlike TULIP, where Elsevier took a leading role in the design and oversight of the experiment, PEAK was a University of Michigan experiment in which Elsevier was a participant. Wendy Pradt Lougee, from the university library, was PEAK project director and Jeffrey K. Mackie-Mason, a professor in the School of Information and Department of Economics, led the economic design team that included economics graduate students, librarians and technologists. It fell to Jeff's team to do much of the experimental design and, later, the analysis of the results. Wendy took on the thankless task of recruiting other institutional participants and managing all of the day-to-day processes. They were ably assisted by others within the School of Information.
PEAK was similar to TULIP in having a central data provider and a number of participating libraries. The University of Michigan was the host, offering web access to all Elsevier titles from its site. The participating institutions totaled twelve in all, ranging from a small, highly specialized academic institution to corporations and large research universities. The goal of the experiment was to understand more about how electronic information is valued and to investigate new pricing options.
The participating libraries were assigned by Michigan to one of three groups (Red, Green and Blue). There were also three pricing schemes for content access being tested and each library group had some (but not full) choice among these three pricing schemes.
In addition to the content fees (which came to Elsevier), Michigan charged a "participation fee," to offset some of their costs, ranging from $1000 to $17,000 per year. The fee was differentially set based on the relative size (e.g., student population) of the institution.
What were the pricing choices?
Per article purchase — The charge was $7 per article. After this type of purchase, the article was available without additional charge to the requesting individual for the duration of the experiment.
Generalized subscription — $548 for a bundle of 120 articles ($4.57 per article). Bundles had to be purchased at the beginning of the year and the cost was not refundable if fewer articles were actually used. Articles in excess of the number purchased as bundles were available at the $7 per article price. Articles accessed under this option were available to the entire user community at no additional charge for the duration of the experiment.
Traditional subscription — $4 per issue (based on the annual number of issues) if the title was subscribed to in paper; $4 per issue plus 10% of the print price if the title was not subscribed to in paper; full price of the print if the print were to be cancelled during the experiment. Those purchasing a traditional subscription had unlimited use of the title for that year.
In addition to the paid years (1998 and 1999), there were back years (1996-1997) available for free.
Elsevier participated in the pricing in the sense that we had discussions with our Michigan counterparts on pricing levels and in the end agreed to the final prices. There was some give and take on what the prices should be and how they should be measured (e.g., using issues as a measurement for the traditional subscriptions was a compromise introduced to permit some reflection of the varying sizes of the journals). We had hesitation about the low levels of the prices, feeling these to be unrealistic given real costs and the usage levels likely to develop. But in the end we were persuaded by the economic and experimental design arguments of Jeffrey Mackie-Mason.
Once the prices were set, the Red group had all three pricing alternatives to choose from, Green had choices 1 and 2 and Blue had choices 1 and 3. In making choices, some decided to take all three, some to take only the per article transactions or only the generalized subscription. As the experiment ran more than one year, there was an opportunity to recalibrate at the end of 1998 based on what had been learned to date and to make new decisions for 1999.
The process of agreeing to and setting up the experiment and then actually getting underway took much longer than any of the participants expected. We had all hoped for an experiment of at least two years (1997-1998). We started our discussions no later than late 1995 or early 1996. The experiment was actually live in 1998 and ended in August, 1999. It is hard now to reconstruct what happened to delay the experiment. Perhaps most of the initial long delay was a result of Elsevier's hesitation on pricing issues (more on this below), although the experimental design also took time at Michigan. The difficulties later were more in the implementation process. Signing up institutions was difficult. Many institutions that were approached were unsure about the price in general and wanted, for example, a lower participation fee, hence the ultimate range of fees negotiated. They were also concerned about participating in an experiment and felt there could be some confusion or difficulty in explaining this to their users. Once signed, start-up also took time at each location. In addition, there was a need, not always immediately recognized, for marketing and promotion of PEAK availability on campus.
5.4 Elsevier's ScienceDirect activities during PEAK
During the PEAK experiment, the management of the experiment and day-to-day contact with participants, including all billing, was handled by Michigan. There were times when we at Elsevier wanted to be more involved in the daily activities, including sending in our sales support staff to assist in training or promotion of the service. We were concerned about the slow start-up at many sites, fearing this would be interpreted as low demand for the journals instead of the effect of needing to promote and acquaint users with the service, something we had learned from TULIP and ScienceDirect. Michigan discouraged this for valid reasons: (1) it was not our system, so we were not familiar with its features and (2) this could interfere with the experimental design.
Instead, we focused on production of the electronic files — and we had plenty to be concerned about. Elsevier was the supplier of the testbed journals and, in that context, was most active in trying to improve delivery performance. The product delivered to Michigan under the EES program at that time was the same as TULIP — images scanned from the paper copy. That meant they were, by definition, not timely. Also, there were issues missing and problems within the files. Additionally, not all format changes were handled with appropriate forewarning on our part. Occasional problems also occurred on the Michigan end, as when it was discovered that there were about 50 CDs that had inadvertently not been loaded onto the server by Michigan. This type of problem was not unique to Michigan but is symptomatic of the problems encountered with local hosting.
Stepping back, it is important to understand Elsevier's product and pricing development during this same time period. The EES product line (the commercialization of TULIP) was available at the time TULIP was ending. It was being sold on a "percentage of print" pricing model, where subscribing institutions paid an additional percentage to receive the electronic files and supplied their own hardware and software. When first introduced, the electronic price had been announced at 35% of the underlying print subscription price (i.e., a total of 135% for paper and electronic). This percentage was chosen because it was the amount that would be required to compensate if all duplicate paper subscriptions were cancelled. It was quickly clear that this was too high, both in terms of what libraries were prepared to pay and what the product was worth. We lowered the price, in the case of Michigan for example, to less than a 5% charge in addition to the paper price. We set such a low price set because we very much wanted Michigan to continue with the electronic package.
While Elsevier actively sold the EES product, it had also started in 1995 with the design of what would become ScienceDirect, our web-based electronic journal system. This would be driven by the direct output of a single journal production system that would create electronic files from which both the paper and electronic products could be produced. The new system, which would feed ScienceDirect online, would offer journal articles both in HTML (from SGML files) and in PDF.[3] ScienceDirect would also incorporate some of the lessons learned from TULIP, including the integration of a broader abstracting and index layer with the full text.
ScienceDirect was in beta testing in late 1997, just as the implementation of PEAK was underway. It was available for full commercial use (without charge) in 1998 and sold starting in 1999. That means that the pricing decisions for this product — as well as EES, later SDOS — were going on simultaneously with PEAK. That, in itself, was a source of frustration to the PEAK participants, as there appeared to be a hope that PEAK would lead to a new pricing scheme and Elsevier would not make pricing decisions until PEAK was completed. That was an unrealistic hope from the beginning and one that Elsevier should have done more to temper.
ScienceDirect pricing had as its fundamental initial objective a desire to smooth the transition from paper to electronic. That meant from our side there was a strong incentive to try to maintain the present library spending level with Elsevier Science. We were hoping to reduce the cancellation of subscriptions. Pricing also had to be explainable by a new team of sales managers and librarians still going through the teething stages of licensing. It could not be too difficult to explain or require too much of a change in thinking.
We also felt that we could not depart too quickly from the present paper-based journal title, volume, year subscription model. We considered pricing models that were based on separating the content charge from a media charge or that were more reflective of use or the number of users. We also considered making electronic journals the principal charge, with paper as an add-on. In the end, we decided it was too early and too little was known to make substantive changes from the "print plus" model. No one at this stage was prepared to cancel print subscriptions and go electronic-only. The electronic services were too new, electronic archiving had not been addressed in any meaningful way, and the bottom line to be considered by a library was generally, "How much is this going to cost me in addition to what I am already paying, i.e., in addition to print?"
This translated into the following pricing formula, which was offered for the 1999 subscription year and continued into 2000:
The fees paid by a ScienceDirect customer had three components: platform fee, content fee and transactional fee.
The platform fee was essentially a utility fee to help compensate for the basic costs of developing and maintaining the service. The platform fee reflected the type of institution (academic or corporate) and the number of people within the class of people authorized as users of the system. This was the most novel (and controversial) part of the pricing model from the library's point of view.
If standard accounts wanted to either select only a subset of their paper journals to receive electronically or to cancel duplicates or unique titles from their paper collection, then the content fee was 15% of the paper list price for the titles involved. There was a 10% discount for electronic-only subscriptions.
Finally, subscribers could purchase single copies of articles in journals outside of their subscriptions on a per-transaction basis; the standard price per transaction was $30.
For customers prepared to make a "full commitment," which meant to continue spending at the level currently spent on paper, then the content fee was reduced to 7.5%. Also a significant transactional allowance permitted these customers to get articles outside of their subscribed titles at no cost, and then at $15 per copy if the allowance was used up. They could also substitute within the total spending commitment — that is, cancel a duplicate or unique title (particularly as they got more usage data) and substitute titles of equal value. This permitted an institution to recalibrate its collection as it gathered more usage data.
For consortium customers, it was possible to construct situations where either all members of the consortium had access to all of the Elsevier titles or, for a "cross-access fee," each member could access anything subscribed to by another member of the consortium.
Finally, there were sometimes areas for negotiation, such as the actual amount of the platform fee, the possibility of price caps on print increases from year to year (in multiple year contracts) and, in some cases, the content fee percentage as well. Negotiation was a reflection of the individual needs, goals and readiness levels of specific institutions or consortia, making the comparison of any two licenses difficult.
5.5 ScienceDirect versus PEAK pricing
It may be helpful to compare the ScienceDirect pricing as in effect during the transition from PEAK with PEAK pricing. From the [the following table][table ]tbl:hunter_tbl one sees: (1) both had a charge to help defray host service costs (and in both cases, that charge did not provide full cost recovery); (2) the ScienceDirect and PEAK content fees were somewhat similar, although PEAK charges were on a flat fee basis and were lower (which was of concern to us from the beginning, as that seemed unrealistic); (3) the transactional fees were also lower for PEAK and permitted continued electronic re-use by the individual purchaser; and (4) nothing in ScienceDirect was comparable to PEAK generalized subscriptions.
| Pricing Feature | ScienceDirect | PEAK | Comments |
| host charge | platform fee | participation fee | often subject to negotiation; SD fees generally higher than PEAK, but not always |
| content charge (SD) or traditional subscription access (PEAK) | % of print charge | flat $4 per issue | PEAK cheaper — e.g., for 2000, Physics A has 56 issues and costs $4374.$4/issue = $224 for PEAK vs. 7.5% = $328 for SD. |
| transactions | free transactional allowance; $15 or $30 otherwise | $7 per article | in SD, window of 24 hours of access for each transaction; in PEAK, individual has continuing online access to the article |
| generalized subscription | nothing comparable | bundles at $548 for 120 articles | continuing online community access to purchased articles |
The two parallel tracks came together during 1999 when it was necessary to plan for the end of PEAK and a transition to ScienceDirect for those libraries wishing to continue to have access to Elsevier journals. We were not willing to continue the experiment beyond August, 1999. As it developed, PEAK participants did not have the option to continue accessing the journals from Michigan on a commercial rather than experimental basis, as Michigan decided it was ready to stop serving as a host and, indeed, did not want to continue to receive and mount journals locally for their own use either. Michigan chose to become a ScienceDirect online subscriber. Michigan's decision to cease local hosting was a combination of two factors: the end of the research project and the relative cost-effectiveness for Michigan of ScienceDirect online versus a local implementation. (Elsevier does have arrangements with other SDOS sites — University of Toronto, Los Alamos, and OhioLINK among others — where one institution serves as a host for other libraries.) It was necessary to make a transition plan early in 1999, before PEAK had ended and before the data could be evaluated. What could we take from PEAK (and from non-PEAK ScienceDirect experience) to inform the transition process?
5.6 Access to the whole database
There were two messages we heard from institutions involved in PEAK: the desire for flexibility in pricing (an ability to make choices) and the value of providing access to the entire database. Of these, perhaps not surprisingly, the second message was one we also heard from other customer environments, such as OhioLINK and Toronto, where the user has access to the entire database — namely, there is significant use of articles from non-subscribed titles. Therefore, anything we could do to increase access to the whole database would be a win-win solution for ScienceDirect subscribers.
In PEAK, it follows therefore that the most satisfied participants were those using the generalized subscription model. They liked the notion of having access to the entire database and of not having to pre-select on a journal title basis. Even though almost everyone overbought bundles in 1998, that was generally a reflection of the slower start-up (i.e., if one annualized the monthly use near the end of 1998, the total purchase for the year would generally have been correct). The purchases for 1999 were much more accurate. This also reflects, in our judgment, the need for marketing and promotion (only recognized late in the process) and the need to build a knowledgeable user base.
It is worth briefly considering the experiences of one PEAK customer, Vanderbilt University, in a bit more detail.[4] Going into PEAK, Vanderbilt subscribed to 403 of the 1,175 Elsevier journals in PEAK at a cost of approximately $700,000 per year. They chose to use only the generalized model, paying $24,600 for 5,400 tokens in 1999. For many reasons (including the Michigan requirement for a registration process, normal ramping up and the critical introduction part way through the year of a link from their OPAC), tokens were not used at the rate anticipated, ending 1998 with slightly more than 2,800 tokens used. More interesting, however, is what was purchased with these tokens. First, there was heavy use of the engineering titles, attributed to the generally poor quality of the engineering paper collection. Haar commented, "Thus information-starved engineering quickly recognized PEAK as a dream come true..." Second, looking more broadly, Vanderbilt users accessed articles from 637 journals. Of those, 45% (289) were also subscribed to in paper. The remaining 55% (348 titles) were not subscribed to in paper. And, of the 403 titles Vanderbilt subscribed to in paper, 114 (28%) were not used online.
In his paper, John Haar of Vanderbilt ascribes some of this behavior to the engineering situation and some to the fact that there was little promotion of PEAK availability within the medical community. I agree with Haar that some of the lower online use of titles subscribed to in paper may be attributable to problems Elsevier had in providing current issues. If an important journal can be read more quickly in paper than online, then it may not be surprising that the online use is modest. That is, admittedly, a more optimistic spin on the data, but one that we believe has to be considered in evaluations.
It is interesting to compare data during essentially the same time (April 1998 - March 1999) on the use of Elsevier and Academic Press journals by OhioLINK. At the annual American Library Association meeting in June, 1999, Tom Sanville, Executive Director of OhioLINK, presented these average use figures for the 13 universities within OhioLINK:
1,345 Elsevier and Academic journals were available, of which on average (at the institutional level) 362 were owned in print
1,035 journals had articles downloaded from them
of the 1,035 downloaded articles, on average, 318 were held in print and 735 (about 70%) were not held in print
19,284 articles were downloaded, of which 9,231 (48%) were from journals not held in print
This reinforced for us a essential message: there is tremendous value in finding ways to give people access to the entire database. Although there are some collection development librarians who have continued to argue strenuously on listservs that is it essential to select and acquire only on a title-by-title basis, the facts do not support that position. Clearly, in an era of limited funding and budgets inadequate to acquire everything needed by faculty and students, systems that make it easy to access a broad range of refereed information offer significant user advantages. Having said this, however, it is clear that there is still room for much more research in how users actually use services such as ScienceDirect, what value they place on which functionalities and content, and which enhancements they will appreciate most.
5.7 Transition from PEAK to ScienceDirect
Given this, there was a push by some PEAK participants for a continuation of the generalized model in the commercial ScienceDirect service. At Elsevier this was extensively discussed. While it would not be immediately possible to switch to a system where one "permanently" buys access at the article level, over the long term it was certainly possible to consider doing this. There was a sense that this "permanent" access gave the libraries a sense of ownership not otherwise present in a license arrangement. Yet, to date we have not adopted the generalized model, preferring other ways of giving full access to the database and providing long-term access rights.
The obvious question is: why not adopt this model? The reason is that from the Elsevier perspective this model runs counter to what we would like to achieve. Our goal is to give people access to as much information as possible on a flat fee, unlimited use basis. Our experience has been that as soon as the usage is metered on a per-article basis, there is an inhibition on use or a concern about exceeding some budget allocation. The generalized model, although offering access to the whole database, is in the end simply a transaction model where the cost of the transaction has been discounted in return for non-refundable prepayment. It is a hybrid — a subscription-based transactional system. It also carries with it increased costs of selling, educating and general marketing to get to the point that a flat rate, all-you-can-use system automatically offers.
What, then, did we do in the transition from PEAK to ScienceDirect for those making the transition? We gave all PEAK customers, as thanks for participating in the experiment and as a way of continuing the transition, unlimited access through 2001 to all titles in the database, but with fees based solely on subscribed content in 1999. For some of the smaller institutions this was an incredibly generous offering. For all schools except Michigan (which would have "earned" a large free transaction allowance in any case) it was a significant improvement over either a normal ScienceDirect license or a PEAK generalized subscription model. What will happen after 2001? We plan to have new pricing plans in place that will make a continuation of access to the whole database possible for the former PEAK — and all other ScienceDirect — accounts.
Also in the transition, in order to address some of the "ownership" concerns, we formalized an electronic archiving and long-term access policy. This policy guarantees that guarantees that we will assume responsibility for the long-term availability of the archive of the Elsevier Science-owned electronic journals and provide access to that archive on an ongoing basis for all years for which an electronic subscription was purchased. Implementation of this policy continues to evolve, including exploration of deposit arrangements with various major libraries worldwide and special consideration of how to accommodate journals which are sold (i.e., for which the publishing contract is lost or are otherwise no longer currently published by Elsevier). We believe that in the long run these policies will result in better certainty of access and a more scalable system than tracking individual institutional purchases forever at the individual article level, as the generalized model requires.
5.8 Longer term effect of PEAK on ScienceDirect
What, then, has been the effect of PEAK on Elsevier Science thinking? As was noted above, there were two outstanding lessons we took from PEAK. One is the value of access to the whole database, which was core to our new product and pricing discussions in 2000. The second is the desire to have choices, to be able to tailor what is purchased to local needs.
In response to this second point, Elsevier moved in January, 2000, to introduce a second product line called ScienceDirect Web editions. This provides free access to PDF files for all titles subscribed to in paper. Initially, Web editions did not have all the functionality of the full ScienceDirect and were limited to a nine month rolling backfile. For many libraries, this is the "choice" they want to have and they have decided to sign up for the Web editions rather than the full ScienceDirect. This was positive for Elsevier as well, as it meets more libraries' needs.[5]
There are other product and pricing changes in discussion at the Elsevier board level. The discussions leading up to these changes reflect what we have learned from ScienceDirect and PEAK to date. PEAK has provided significant input to the broad thinking process and we are grateful to the University of Michigan, and in particular to Wendy Pradt Lougee and Jeffrey Mackie-Mason, for their insight and persistence in making this happen. We hope that the discussion of the pricing and packaging of electronic products, particularly journals, will continue in a spirited way.
Notes
1. Full information on TULIP is available at http://www.elsevier.com/wps/find/librariansinfo.librarians/tulip
.![]()
2. Full information on PEAK is available at http://web.archive.org/web/20011127031111/www.lib.umich.edu/libhome/peak/.![]()
3. Recall that EES (later renamed ScienceDirect On Site — SDOS) was at that time taking the paper product and scanning it, creating a time delay. SDOS currently delivers PDF files created directly in the production process, avoiding the time delays for most journals.![]()
4. (Haar, 1999).![]()
5. During 2000, Web editions were dramatically increased in functionality and coverage was increased to twelve months.![]()
6. User cost, usage and library purchasing of electronically-accessed journals
6.1 Introduction
Electronic access to scholarly journals has become an important and commonly accepted tool for researchers. Technological improvements in, and decreased costs for, communication networks and digital hardware are inducing innovation in digital content publishing, distribution, access and usage. Consequently, although publishers and libraries face a number of challenges, they also have promising new opportunities.[1] Publishers are creating many new electronic-only journals on the Internet, while also developing and deploying electronic access to literature traditionally distributed on paper. They are modifying traditional pricing schemes and content bundles, and creating new schemes to take advantage of the characteristics of digital duplication and distribution.
The University of Michigan operated a field trial in electronic access pricing and bundling called "Pricing Electronic Access to Knowledge" (PEAK). We provided a host service providing access to roughly four and a half years of content (January 1995 - August 1999) including all of Elsevier Science's approximately 1200 scholarly journals. Participating institutions had access to this content for over 18 months.[2] Michigan provided Internet-based delivery to over 340,000 authorized users at twelve campuses and commercial research facilities across the U.S. The full content of the 1200 journals was received, catalogued and indexed, and delivered in real time. At the end of the project the database contained 849,371 articles, and of these 111,983 had been accessed at least once. Over $500,000 in electronic commerce was transacted during the experiment. For further details on this project, including the resources needed for implementation, see Bonn et al. (this volume).
We elsewhere describe the design and goals of the PEAK research project (MacKie-Mason and Riveros (2000)). In MacKie-Mason et al. (2000) we detail the pricing schemes offered to institutions and individual users. We also report and analyze usage statistics, including some data on the economic response of institutions and individuals to the different price and access options.
In this paper, we focus on an important behavior question: how much does usage respond to various differences in user cost? We pay careful attention to the effect of both pecuniary costs and non-pecuniary costs such as time and inconvenience.
An interesting aspect of the PEAK project is the role of the library as economic intermediary and the effects of its decisions on the costs faced by end users.[3] In the first stage of the decision process, the library makes access product purchasing decisions. These decisions then have a potentially large effect on the costs that users face in accessing particular electronic journal articles, whether it be the requirement that users obtain and use a password or pay a monetary cost. The consumer then decides whether she will pay these costs to access a given article.
The standard economic prediction is that a user will access an article if the marginal benefit she expects from the article (i.e. the incremental value) is greater than her marginal cost. Different users are going to have different valuations for electronic access to journal articles. Furthermore, even the same user will not place the same value on all requested articles. Information regarding users' sensitivity to user cost (known to economists as the elasticity of demand) for various articles is important to an institutional decision-maker who wants to maximize, or at least achieve a minimally acceptable level of user welfare.[4] Demand elasticity information is also vital to firms designing access options and systems because design decisions will affect non-pecuniary costs faced by the users, and thus overall demand for access.
It is well known that the usage of information resources responds to the monetary cost users bear. We find that even modest per article fees drastically suppressed usage. It is also true, but perhaps less appreciated, that non-pecuniary costs are important for the design of digital information access systems. We find that the number of screens users must navigate, and the amount of external information they must recall and provide (such as passwords), have a substantial impact on usage. We estimate the amount of demand that was choked off by successive increases in the user cost of access. Further, we find preliminary evidence that users were more likely to bear these costs when they are expected. Finally, given the access options and prices offered in the PEAK experiment, we calculate the least costly bundles of access options an institution could have purchased to meet the observed usage, and compare this to the actual bundles purchased in each year. From this comparison we learn about the nature of institutional forecasting errors, and the potential cost savings to them from the detailed usage information of the sort provided by PEAK.
6.2 Access options offered
To choose which access products (and their prices) to offer PEAK participants, we balanced a complex set of considerations. These included the desire to study innovative access options, the desire to create substantial experimental variation in the data, and the need to entice institutions to participate. Hunter (this volume) gives a fuller account of these deliberations. In the end, participating institutions in the PEAK experiment were offered packages containing two or more of the following three access products:
Traditional Subscription: Unlimited access to the material available in the corresponding print journal.
Generalized Subscription: Unlimited access (for the life of the project) to any 120 articles from the entire database of currently priced content. Articles are added to the generalized subscription package as users request articles that were not already otherwise paid for, until the subscription is exhausted.[5] Articles selected for generalized subscriptions may be accessed by all authorized users at that institution.
Per Article: Unlimited access for a single individual to a specific article. If an article is not available in a subscribed journal, nor a generalized subscription, nor are there unused generalized subscription tokens, then an individual may purchase access to the article, but only for his or her use (for the life of the project).
The per-article and generalized-subscription options allow users to capture value from the entire corpus of articles, without having to subscribe to all journal titles. Once the content is created and added to the server database, the incremental delivery cost (to the publisher and system host) is approximately zero. Therefore, to create maximal value from the content, it is important that as many users as possible have access. The design of the pricing and bundling schemes affect both how much value is delivered from the content (the number of readers) and how that value is shared between the users and the publisher.
Generalized subscriptions may be thought of as a way to pre-pay (at a discount) for interlibrary loan requests. One advantage of generalized subscription purchases is that the "tokens" cost substantially less per article than the per-article license price. Institutions did, however, need to purchase tokens at the beginning of a year and thus bore some risk. There is an additional benefit: unlike an interlibrary loan, all users in the community have ongoing unlimited access to the articles obtained via generalized subscription token. To the publisher, generalized subscriptions represent a committed flow of revenue at the beginning of each year, and thus shift some of the risk to the users. Another benefit to the publisher, as noted by Hunter (this volume), is that that they open up access to the entire body of content to all users. Generalized subscriptions thus offer one method for the publisher to increase user value from the already produced content, and which creates an opportunity to obtain greater returns from the publication of that content.
| Institution ID | Group | Traditional | Generalized | Per Article |
| 5, 6, 7, 8 | Green | X | X | |
| 3, 9, 10, 11, 12 | Red | X | X | X |
| 13, 14, 15 | Blue | X | X |
Participating institutions were assigned randomly to one of three different experimental treatments, which we labeled as the Red, Green and Blue groups. Institutions in every group could purchase articles on a per-article basis. Those in the Green group could purchase generalized subscriptions, while those in the Blue group could purchase traditional subscriptions. Institutions in the Red group could purchase all types of access. Twelve institutions participated in PEAK: large research universities, medium and small colleges and professional schools, and corporate libraries. Table 6.1 shows the distribution of access models and products offered to the participating institutions.
6.3 Summary of user costs
The PEAK experiment was designed to assess user response to various pricing and access schemes for digital collections. Since the content was traditional refereed scholarly literature, we implemented access through the traditional intermediary: the research library. The reliance on research libraries affected the design of the experiment and thus the research questions we could investigate. As we noted above, the intermediary, by choosing the combination of access products available to users, determines the costs faced by its users. The individual users then make article-level access decisions.[6] Thus, there are two different decision makers playing a role in access decisions. We must take both into account when analyzing the usage data.
When confronted with the PEAK access options and prices, nearly all of the participating libraries purchased substantial prepaid (traditional or generalized subscription) access on behalf of their users. As a consequence, relatively few users were faced with the decision of whether or not to pay a pecuniary charge for article access. Although we measured over 200,000 unique individual uses of the system, we estimate that a user was asked to pay a pecuniary cost in only about 1200 instances. Therefore we focus as much on user response to non-pecuniary costs as to pecuniary costs.
Access at zero user cost. Substantial amounts of PEAK content were available at zero user cost. This content included:
all "unmetered" content, which included articles published at least two calendar years prior as well as all non-full-length articles;
articles in journals to which the institution purchased an electronic traditional subscription; and
articles which had previously been purchased by a user at the institution with a generalized subscription token.
All such access required authentication, but this was most often accomplished automatically by system verification that the user's workstation IP address was associated with the participating institution. Thus, most such authentications required no user time, effort or payment, and the overall marginal user cost per access was zero.[7]
Access at medium user cost. For some access, users incurred a higher cost because they were required to enter a password. The transactions cost of password entry ranged from small to substantial. In the worst case, the user needed to navigate elsewhere in the system to fill out a form requesting a password, and then wait to receive it via e-mail. Once received, the user had to enter the password. If the user previously obtained a password, then the only cost to her was to find or recall the password and enter it. Content accessible via password entry included:
articles in journals to which the institution did not have a traditional subscription, assuming that the institution had generalized tokens available;
subsequent access to an article which an individual previously purchased on a per-article basis.
Access at high user cost. If the institution did not have any unused generalized subscription tokens, then content not available at zero cost could be accessed by payment of a $7 per-article fee. The user who wished to pay the per-article fee would also bear two non-pecuniary costs: (1) password recall and entry, as above for the use of a generalized subscription token, and (2) credit card recall and entry.[8] In many cases, institutions subsidized, either directly or indirectly, the per-article fee. Although subsidized, access of this type still resulted in higher transactions costs. In the indirect subsidy case, a user needed to submit for reimbursement. In the direct case, except at institution 15, users needed to arrange for the request to be handled by the institution's interlibrary loan department.
Exceptions. Several of the access procedures—and thus users' costs —were different at institutions 13 and 14. At both, per-article access for all requests was paid (invisibly to the user) by the institution, so users never faced a pecuniary cost.[9] At institution 14, a user still faced the non-pecuniary cost of finding her password and entering it to access "paid" content.[10] However, all users at institution 13 accessing from associated IP addresses were automatically authenticated for all types of access. Thus users at institution 13 could access all PEAK content at zero total (pecuniary and non-pecuniary) cost. These differences in access procedures were negotiated by the production and service delivery team during the participant acquisition phase, with the approval of the research team. In our analyses below we use the differences in user cost between these two institutions and the others as a source of additional experimental variation.
Complexity. From the description above, it might appear that the PEAK access program was much more complicated than one would expect to find in production services. If so, then our results might not generalize readily to these simpler production alternatives.
In fact, most of the complexity is at the level of the experiment, and as such creates a burden on us (the data analysts), and on readers, but not on users of the PEAK system. Because this was an experiment, we designed the program to have different treatments for different institutions. We had to keep track of these differences, but users at a single institution did not need to understand the full project (indeed, they were not explicitly informed that different variations of PEAK were available elsewhere). In most cases they did not even need to understand all three access options, because most institutions had only two options available to them.
Among our three access options, the traditional subscription and per-article fee options were designed to closely mimic familiar access schemes for printed journals, and as such they did not cause much confusion. The generalized subscription was novel, but the details largely were transparent to end users: they clicked on an article link, and either it was immediately available, or they were required to enter a password, or they were required to pay a per-article fee. Whether the article was available through a traditional or generalized subscription was not relevant to individual users. Thus, to the user the access system had almost identical complexity to existing systems: either an article is available in the library or not, and if not the user can request it via interlibrary loan (and/or with a per-article fee from a document delivery service).
The librarians making the annual PEAK purchasing decisions needed to understand the differences between traditional and generalized subscriptions of course. We prepared written explanatory materials for them, and provided pre-purchase and ongoing customer support to answer any questions. In section 6.6 below we discuss some evidence on how learning about the system changed behavior between the first and second year, but we did not observe any significant effects we could attribute to program complexity.
6.4 Effects of user cost on access
In this section, we measure the extent to which user costs to access PEAK content affected the quantity and composition of articles actually accessed. Clearly the costs and benefits of accessing the same information via other means, particularly via an institution's print journal holdings, will have an enormous impact on a user's willingness to bear costs associated with PEAK access. We do not explicitly model these costs, although we do control for them at an institutional level. Kingma (this volume) provides estimates of some costs associated with information access via several non-electronic media.
As noted above, user costs for accessing PEAK content depended on a variety of factors. One factor is the type of content requested ("metered" versus "unmetered"). Looking only at metered content, the pecuniary and non-pecuniary costs associated with access depended in large part on the access products purchased by a user's institution. Further, the access costs faced by users within a given institution depended on the specific products selected by an institution (i.e. the specific journals to which an institution holds a traditional subscription, and the number of generalized subscription tokens purchased), individual actions (whether a password had already been obtained) and also on the actions of other users at the institution (whether a token had already been used to purchase a requested article, and how many tokens remain). In the following sections, we estimate the effects of these incremental costs on the quantity and composition of metered access.
Non-pecuniary costs
To gauge the impact of user cost of usage on aggregate institutional access, we compared the access patterns of institutions in the Red group with those in the Blue group. Red institutions had both generalized and traditional subscriptions available; Blue had only traditional. Users at both institutions could obtain additional articles at the per-article price. We constructed a variable we call "Normalized Paid Accesses" to measure the number of "paid" accesses to individual articles (paid by generalized tokens or by per-article fee) per 100 unmetered accesses, normalized to account for the number of traditional subscriptions. Adjusting for traditional subscriptions accounts for the amount of prepaid content provided by the user's institution; adjusting for unmetered accesses adjusts for the size of the user community and the underlying intensity of usage in that community.[11]
| Institution | Access group | Normalized paid accesses per 100 unmetered accesses |
| 3 | Red | 13.5 |
| 9 | Red | 20.4 |
| 10 | Red | 31.7 |
| 11 | Red | 7.59 |
| 12 | Red | 26.4 |
| Average | Red | 15.1 |
| 13 | Blue | 51.0 |
| 14 | Blue | 15.1 |
| 15 | Blue | 4.72 |
We use our statistic, Normalized Paid Accesses, as a measure of relative (cross-institution) demand for paid access. We present the statistic in Table 6.2. Even after controlling for the size of an institution's subscription base and the magnitude of demand for unmetered content, paid demand differed among institutions with the same access products. This suggests that there are institution-specific attributes affecting demand for paid access. It is also possible that we incompletely control for subscription size. One possibility is that the number of traditional subscriptions affects the cost a user expects to have to pay for an article before the actual cost is realized. Users at an institution with a large traditional subscription base, such as institution 3, would have had a lower expected marginal cost for access as a large percentage of the articles are accessible at zero cost. Some users at these institutions might attempt to access articles via PEAK, expecting them to be free, while not willing to pay the password cost when the need arises. This difference between expected and actual marginal cost may be important; we return to this point later.
We can make some interesting comparisons between institutions in the Red group and those in the Blue group. While institution number 13, as a member of the Blue group, only had traditional subscriptions and per-article access available, users at this institution did not need to authenticate for any content, and thus faced no marginal cost in accessing any paid content. Most users at Red institutions faced the cost of authenticating to spend a token.[12] We would therefore expect a higher rate of paid access at institution 13, and this is in fact the case.
Paid access at institution 14 was similarly subsidized by the institution. However, in contrast to institution 13, authentication was required. Thus the marginal user cost of paid access at institution 14 was exactly the same as at the Red institutions. We therefore expected that demand for paid access would be similar. This is in fact the case: Normalized Paid Access is 15.1 at both. Finally, per-article access for users at institution 15 was not automatically subsidized. Thus, users faced very high marginal costs for paid content. In addition to the need to authenticate with a password, users at this institution needed either to: a) pay the $7.00 per-article fee and enter their credit card information; or b) arrange for the request to be handled via the institution's interlibrary loan department. In either case, the user cost of access was higher than password only, and, as we expected, the rate of paid access was much lower than in the Red group.
| No month dummies | Month dummies | |
| Constant | 87.535* | 108.615* |
| (10.394) | (14.643) | |
| Blue: Credit Card (Inst. 15) | -280.490* | -270.879* |
| (37.627) | (35.508) | |
| Red + Institution 14 | -58.999* | -57.764* |
| (7.900) | (7.186) | |
| Out of Tokens | -25.070* | -25.665* |
| (1.635) | (2.533) | |
| Graduate Students/Faculty Ratio | 43.821* | 41.748* |
| (7.301) | (6.912) | |
| Percentage Engineering, Science and Medicine | -225.913* | -215.767* |
| (7.535) | (36.553) | |
| Sample Size | 530 | 530 |
| R2 | 0.171 | 0.229 |
Table 6.3 summarizes the results from a multiple regression estimate of the effects of user cost on access. We controlled for differences in the graduate student / faculty ratio and the percentage of users in Engineering, Science and Medicine.[13] The dependent variable, Paid accesses per 100 unmetered accesses, controls for learning and seasonality effects. We thus see the extent to which paid access, starting from a baseline of access to paid content at zero marginal user cost, falls as we increase marginal costs. Imposition of a password requirement reduces paid accesses by almost 60 accesses per 100 unmetered accesses (Red and institution 14), while the depletion of (institution-purchased) tokens results in a further reduction of approximately 25 accesses (per 100 unmetered).
We use the distinction between metered and unmetered access to further test the extent to which increased user costs throttle demand. As a reminder, full-length articles from the current year are metered: either the institution or the individual must pay a license fee to gain access. Other materials (notes, letters to the editor, tables of contents, and older full-length articles) are not metered: anyone with institutional access to the system can access this content after the institution pays the institutional participation license fee. Some of the unmetered content comes from journals that are covered by traditional subscriptions, some from journals not in subscriptions. We calculate the ratio of this free content accessed from the two subsets of content. If we make the reasonable assumption that, absent differential user costs, the ratio of metered content from the two subsets would be the same as the ratio of unmetered content, then we can estimate what the demand would be for metered content outside of paid subscriptions if that content were available at zero user cost (e.g., if the institution added the corresponding journals to its traditional subscription base). Our estimate is calculated as:
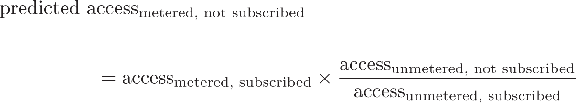
| Institution | Year | Actual Per Predicted | Percent Free Access Psswd. Authent. | Credit Card Required | Password Entered When Prompted |
| 3 | 1998 | 21.1% | 11.1% | 0 | 6.69% |
| 10 | 1998 | 146.2% | 45.4% | 0 | 13.5% |
| 11 | 1998 | 16.4% | 8.81% | 0 | 2.6% |
| 12 | 1998 | 83.3% | 51.7% | 0 | 7.14% |
| 13 | 1998 | 125.9% | 98.8% | 0 | 100.0% |
| 14 | 1998 | 79.3% | 54.5% | 0 | 44.4% |
| 15 | 1998 | 0.00% | 22.2% | 1 | 8.06% |
| 3 | 1999 | 31.4% | 19.1% | 0 | 10.4% |
| 10 | 1999 | 123.4% | 43.9% | 0 | 13.4% |
| 11 | 1999 | 20.8% | 18.5% | 0 | 14.1% |
| 13 | 1999 | 77.7% | 100.0% | 0 | 100.0% |
| 14 | 1999 | 56.7% | 63.2% | 0 | 17.8% |
| 15 | 1999 | 19.5% | 12.2% | 1 | 2.39% |
In Table 6.4 we present actual paid access (when customers face the actual user cost) as a percentage of predicted access (at zero user cost) for all institutions that had traditional subscriptions in a given year. All observations except three (institutions 10 and 13 in 1998, and institution 10 in 1999) show actual access substantially below predicted when users bear the actual user cost. We conjecture that the surprising result for institution 10 might be partially due to the fact that they had the fewest traditional subscriptions. Because relatively little was available at zero user cost, users at this institution might have expected to bear the user cost (password recollection and entry in this case) for every access. If this were the case, then our method of predicting access at zero user cost is biased and the results for institution 10 are not meaningful. As for institution 13, recall that its users in fact faced no incremental user cost to access paid materials. We thus expect its paid accesses to be closer to that predicted for zero user cost, and are not surprised by this result.
Though not related to our focus on user cost, there are two other statistical results reported in Table 6.4 that bear mention. First, usage is substantially, and statistically significantly higher when the graduate student / faculty ratio is higher. It is not implausible that graduate students make more frequent use of the research literature, reading more articles while taking classes and working on their dissertations, than more established scholars. This may also reflect life cycle differences in effort and productivity. However, it is also possible that a higher graduate student ratio is proxying for the intensity of research (by both graduate students andfaculty) at the institution, which would be correlated with higher access.
The other, and more surprising result is that the higher is the percentage of engineering, science and medicine (STM) users, the lower is usage, by a large and statistically significant amount. We cannot be sure about the interpretation of this result, either. We were surprised because the Elsevier catalogue is especially strong in STM, reflected in breadth, depth and quality of content. Perhaps the nature of study and research in STM calls for less reading of journal articles, but this conjecture cannot be tested without further data.
For all other institutions we generally see that the user costs associated with paid access caused an appreciable reduction in the number of paid articles demanded. We also present in Table 6.4 factors which we believe help explain this shortfall, namely the percentage of free access that is password authenticated, whether or not a credit card is required for all paid access, and the rate at which passwords were entered for paid access when prompted.
| Independent variable | Coefficient (standard error) |
| Percent Free Psswd. Auth. | 2.12* |
| (.45) | |
| Prompted Login Percent | -1.05** |
| (.54) | |
| Credit Card Required | -.213 |
| (.25) | |
| Sample Size | 13 |
| R2 | 0.85 |
In Table 6.5 we summarize the results from the estimation of the effects of user cost on actual paid access as a percentage of predicted accesses. Despite the small sample size, the results clearly demonstrate that, as we increase the number of individuals who can access paid content without additional marginal costs (proxied by the percent of free access that is password authenticated, which indicates that the password user cost has already been incurred), more paid access is demanded. The dummy variable for credit card required (for per-article payment) is not significant, but there was almost no variation in the sample from which to measure this effect.[14] The coefficient for the percent of prompted users who log in is of the wrong sign to support our hypothesis: we expected that the higher the number of users who are willing to bear the non-pecuniary costs of login, the higher would be the access to paid material.
Pecuniary costs
If an institution did not purchase any, or depleted all of its tokens, a user wanting to view a paid article not previously accessed had three choices.[15] She could pay $7.00 to view the article, and also incur the non-pecuniary cost of entering credit card information and waiting for verification. If the institution subscribed to the print journal, she could use the print journal article rather than the electronic product. She could also request the article through a traditional interlibrary loan, which also involves higher non-price costs (effort to fill out the request form, and waiting time for the article to be delivered) than spending a token.[16]
Due to details of the system design, we are unable to determine the exact number of times that users were faced with the decision of whether or not to enter credit card information in order to access a requested article. We were able to identify in the transaction logs events consistent with the credit card decision (hereafter we call these "consistent events"). These consistent events are, however, a noisy signal for the actual number of times users faced this decision.
We used evidence from the experimental variation to estimate the actual rate of requests for credit card payment. In some months some institutions had unused tokens and thus there were nocredit card (per-article) purchases, since unused tokens are always employed first. For these months we divided the number of consistent events by the number of access requests handled by the system for that institution, to obtain a measure of the baseline rate of consistent events that are not actual credit card requests. For each institution that did deplete its supply of tokens, we then subtracted this estimated baseline rate from the total number of consistent events to measure requests for credit card payment. For institutions that never had tokens, we use the weighted average of the estimated baseline rates for institutions with tokens.
| Institution | Estimated Credit Card Requests | Credit Card Payments | Percent |
| 3 | 53 | 13 | 25.5% |
| 6 | 260 | 194 | 74.6% |
| 9 | 190 | 1 | 0.5% |
| 11 | 562 | 61 | 10.9% |
| 15 | 137 | 73 | 53.3% |
In Table 6.6 we present the number of actual payments as a percent of estimated requests for credit card payments. The relative percentages are consistent with our intuition. Institutions 6 and 15 never had any tokens. We thus expect that users at these institutions expected a relatively high cost of article access, and would not bother accessing the system or searching for articles if they were not prepared to pay fairly often.[17] Among the institutions at which tokens were depleted, the payment rate is appreciably higher at institutions 3 and 11, which is consistent with the fact that at these institutions the user could make an interlibrary loan request for articles through PEAK, and the institution would pay the per article charge on behalf of the user.
We gain further understanding of the degree to which differences in user cost affects the demand for paid article access by looking at only those institutions that depleted their supply of tokens at various points throughout the project. There were three institutions in this category: institution 3 ran out of tokens in November 1998 and again in July 1999; institution 11 in May 1999; and institution 9 in June 1999.
For institutions that had tokens available at certain times, we can estimate the number of credit card requests (by PEAK, to the user) based on the number of tokens spent per free access. If we make the assumption that this rate of token expenditure would have remained constant had tokens still been available, we can estimate the number of credit card requests to be equal to the estimated number of tokens that would have been spent had tokens been available.
| Institution | Credit Card Requests | Credit Card Payments | Percent |
| 3 | 128 | 13 | 10.2% |
| 9 | 366 | 1 | 0.3% |
| 11 | 1128 | 61 | 5.4% |
In Table 6.7 we present the rate of credit card payments as estimated from the rate of token expenditure. The relative percentages are consistent with our previous estimates for these institutions. The estimated number of requests for credit card payment are about twice as high as the estimates in Table 6.6. One possible explanation is that when users know they are going to face a credit card payment request (tokens have run out, which they learn on their first request for an article that is not prepaid) they may make fewer attempts to access material, which would be another measure of the effect of transaction payments on service usage.
| Institution 3 | Institution 3 | Institution 9 | Institution 11 | |
| 1998 | 1999 | 1999 | 1999 | |
| 30 days prior | 13.6 | 18.4 | 20.2 | 16.0 |
| 30 days after | 0.25 | 0.29 | 0.00 | 0.35 |
| Percentage Decrease | -98.2% | -98.4% | -100.0% | -97.8% |
To further quantify the decrease in demand for paid access resulting from a depletion of tokens, in Table 6.8 we present the normalized accesses of metered content per hundred accesses of free content at these institutions for the 30 days prior and subsequent to running out of tokens. Usage plummeted after tokens ran out and users were required to pay per article for access to metered content.
Summary: Effects of user costs
The results we presented in this section demonstrate that increases in user costs substantially diminish demand for paid content. In particular, the decisions made by thousands of users demonstrate that non-pecuniary costs, such as password use, have an impact on demand that is of the same order of magnitude as direct monetary costs.
6.5 Effects of Expected User Cost on Access
As we showed in Table 6.4, at most institutions actual paid usage when users directly paid the user cost was substantially below predicted usage with zero user costs. Users at institution 10 were notable exceptions. We hypothesized that users at this institution might have expected to bear more cost, and they were willing to pay more often when confronted with costs. We explore this hypothesis in this section.
According to our hypothesis, the frequency with which users are asked to pay for content will affect a user's ex ante estimation of how much she will need to pay. This effect on her estimate can stem from either her previous direct experience, or through "word of mouth" learning. It is our hypothesis that the expected access cost affected the probability that a user paid for access when requested.
We have two conjectures about user behavior that would cause willingness to pay to depend on prior expectations about cost. The first concerns an induced selection bias. The higher the expected cost to access an article, the fewer the users who will even attempt to access the information via PEAK. In particular, users with a low expected benefit for an article will generally be less likely to use PEAK at all. The result would be that those who do use PEAK are more likely to pay necessary article access fees. Our second conjecture is that context of the request for payment matters, i.e. there is a "framing" effect. It is possible that if a user is habituated to receiving something for free, she will be resistant to paying for that object, even if her expected benefit is greater than the actual cost.[18] Unfortunately, the data that we have do not permit us to distinguish between these two scenarios.
| Institution | Normalized paid accesses per 100 unmetered | Estimated expected rate of zero cost access | Percent who log in when requested |
| 3 | 13.5 | 83.6% | 8.48% |
| 10 | 31.7 | 6.9% | 13.5% |
| 11 | 7.6 | 74.2% | 2.6 % |
| 12 | 26.4 | 11.1% | 7.1% |
| 14 | 15.1 | 31.4% | 29.6% |
In Table 6.9 we present some evidence that users' expectations do matter. To explore this hypothesis, we rely on the difference in user cost between accesses to traditional subscription material (no password required) and generalized subscription material (password required). Therefore, we report all institutions at which password entry was required in order to spend a generalized subscription token, plus institution 14, at which users faced similar costs. We use accesses of unmetered content—which has zero incremental user cost for all material, whether in traditional subscriptions or not—as our comparison benchmark. In the second column we report the forecast of unmetered content accesses that were contained within the institution's traditional subscription base. We use this as an estimate of the user's expected user cost of access. For example, if 75% of unmetered access came from traditional subscription material, then we estimate that the user also expects 75% of her demand for metered material to be from traditional subscriptions (with zero incremental user cost), and only 25% of requests for metered material to involve the password user cost (for generalized subscription content).
In the last two columns we present measures of user willingness to bear user cost. The institution's normalized paid access is a scaled measure of the rate at which (metered) generalized subscription material was accrued (and thus how soon the password cost was incurred). The pecent who login when requested is another measure of user willingness to bear the password user cost.
The data are consistent with our hypothesis that users with lower expected access costs (see column 2) will be less likely to bear the user cost of password retrieval and entry. The correlation between the expected rate of zero-cost access and normalized paid access is -0.87. We also see a negative correlation of -0.36 between the expected rate of zero cost access and willingness to enter a password when requested.
6.6 Improving library budgeting with usage information
Librarians are in an unenviable position when they select subscriptions to scholarly journals.[19] They must determine which journals best match the needs and interests of their community subject to two important constraints. The budgetary constraint has become increasingly binding because renewal costs have risen faster than serial budgets Haar (1999). The second constraint is that libraries have incomplete information about community needs. A traditional print subscription forces libraries to purchase publisher-selected bundles of information (the journal), while users are interested primarily in the articles therein. Users only read a small fraction of articles,[20] and the library generally lacks information about which articles the community values. Further compounding the problem, a library makes an ex ante (before publication) decision about the value of a bundle, while the actual value is realized ex post.
The PEAK electronic access products relaxed these constraints. First, users had low-cost access to articles in journals to which the institution did not subscribe. This appeared to be important: at institutions that purchased traditional subscriptions, 37% of the most accessed articles in 1998 were outside the institution's traditional subscription base. This figure was 50% in 1999. Second, the transaction logs that are feasible for electronic access allowed us to provide libraries with monthly reports not only on which journals their community valued, but also which articles. Detailed usage reporting should enable libraries to provide additional value to their communities. They can better allocate their serials budgets to the most valued journal titles or to other access products.
In this section we present analyses of the extent to which improved information available from an electronic usage system could lead to reduced expenditures and better service.
Improved budgeting with improved usage forecasts
We first estimate an upper bound on how much the libraries could benefit from better usage data. We analyze each institution's accesses to determine what would have been its optimal bundle if it had been able to perfectly forecast which material would be accessed. We then calculate how much this bundle would have cost the institution, and compare this perfect foresight cost with the institution's actual expenditures. Obviously even with extensive historical data, libraries would not be able to perfectly forecast future usage, so the realized efficiencies from better usage data would be less. Below we analyze how the libraries used the information from 1998 to change their purchasing decisions in 1999.
We present these results by access product in Table 6.10. We found that actual expenditures were markedly higher than optimal purchases in 1998. In particular, institutions in the Red and Blue groups purchased far more traditional subscriptions than would be justified if they had perfect foresight. Most institutions purchased more generalized subscriptions than would have been optimal with perfect foresight. We believe that much of the budgeting "error" can be explained by a few factors:
First, institutions overestimated demand for access, particularly for journals for which they purchased traditional subscriptions.[21]
Second, institutional practices, such as "use it or lose it" budgeting and a preference for fixed, predictable expenditures, might have affected decisions. A preference for predictable expenditures would induce a library to rely more heavily on traditional and generalized subscriptions, and less on reimbursed individual article purchases or interlibrary loan.[22] However, Kantor et. al. (2001) Kantor et al. (this volume) report the opposite: that libraries dislike bundles because they perceive them as forcing expenditures for low-value items.
Third, because demand foresight is necessarily important, libraries might want to "over-purchase" to provide insurance against higher than expected usage demand. Of course, per-article purchases (possibly reimbursed to users) provide insurance (as does an interlibrary loan agreement), but at a higher cost per article than pre-purchased generalized subscription tokens, or than traditional subscriptions.
| Access Product | Totals | ||||||||||
| Traditional | Generalized | Per Article | |||||||||
| Year | Instid | Actual | Optimal | Actual | Optimal | Actual | Optimal | Actual | Optimal | $ Savings | % Savings |
| 1998 | 3 | 25,000 | 17,000 | 2,740 | 3,836 | 7 | 133 | 27,747 | 20,969 | 6,778 | 24.43% |
| 5 | N/A | 0 | 15,344 | 6,576 | 0 | 169 | 15,344 | 6,745 | 8,599 | 56.04% | |
| 6 | N/A | 0 | 0 | 548 | 672 | 0 | 672 | 548 | 124 | 18.45% | |
| 7 | N/A | 0 | 24,660 | 12,604 | 0 | 0 | 24,660 | 12,604 | 12,056 | 48.89% | |
| 8 | N/A | 0 | 13,700 | 2,740 | 0 | 0 | 13,700 | 2,740 | 10,960 | 80.00% | |
| 9 | 0 | 556 | 13,700 | 6,576 | 0 | 56 | 13,700 | 7,188 | 6,512 | 47.53% | |
| 10 | 4,960 | 323 | 8,220 | 7,672 | 0 | 483 | 13,180 | 8,478 | 4,701 | 35.67% | |
| 11 | 70,056 | 5,217 | 2,192 | 13,700 | 0 | 84 | 72,248 | 19,001 | 53,247 | 73.70% | |
| 12 | 2,352 | 107 | 2,192 | 1,096 | 0 | 98 | 4,544 | 1,301 | 3,243 | 71.37% | |
| 13 | 28,504 | 139 | N/A | 0 | 952 | 1,120 | 29,456 | 1,259 | 28,197 | 95.73% | |
| 14 | 17,671 | 0 | N/A | 0 | 294 | 504 | 17,965 | 504 | 17,461 | 97.19% | |
| 15 | 18,476 | 0 | N/A | 0 | 0 | 1,176 | 18,476 | 1,176 | 17,300 | 93.63% | |
| 1999 | 3 | 12,500 | 10,528 | 2,740 | 1,096 | 84 | 0 | 15,324 | 11,624 | 3,699 | 24.14% |
| 5 | N/A | 0 | 8,768 | 2,740 | 0 | 399 | 8,708 | 3,139 | 8,708 | 63.96% | |
| 6 | N/A | 0 | 0 | 548 | 686 | 0 | 686 | 548 | 138 | 20.12% | |
| 7 | N/A | 0 | 10,960 | 9,864 | 0 | 511 | 10,960 | 10,375 | 585 | 5.34% | |
| 8 | N/A | 0 | 6,028 | 5,480 | 0 | 462 | 6,028 | 5,942 | 86 | 1.43% | |
| 9 | 0 | 278 | 7,124 | 6,576 | 7 | 182 | 7,131 | 7,036 | 94 | 1.33% | |
| 10 | 2,480 | 1,401 | 8,768 | 6,576 | 0 | 210 | 11,247 | 8,187 | 3,060 | 27.21% | |
| 11 | 0 | 576 | 4,384 | 2,740 | 427 | 532 | 4,559 | 3,848 | 711 | 15.60% | |
| 12 | 0 | 0 | 1,644 | 548 | 0 | 539 | 1,644 | 1,087 | 557 | 33.88% | |
| 13 | 9,635 | 7,661 | N/A | 0 | 19,964 | 7,175 | 29,599 | 14,836 | 14,763 | 49.88% | |
| 14 | 0 | 0 | N/A | 0 | 623 | 623 | 623 | 623 | 0 | 0% | |
| 15 | 8,992 | 1,058 | N/A | 0 | 511 | 1,694 | 9,502 | 2,751 | 6,751 | 71.04% | |
| Change in expenditure 1998-99 | ||||
| Traditional | Generalized | |||
| Institution | Predicted | Actual | Predicted | Actual |
| 3 | - | 0 | + | + |
| 5 | N/A | N/A | - | - |
| 6 | N/A | N/A | + | 0 |
| 7 | N/A | N/A | - | - |
| 8 | N/A | N/A | - | - |
| 9 | + | 0 | - | - |
| 10 | - | 0 | - | + |
| 11 | - | - | + | + |
| 12 | - | - | - | + |
| 13 | - | 0 | N/A | N/A |
| 14 | - | 0 | N/A | N/A |
| 15 | - | + | N/A | N/A |
We also analyzed changes in purchasing behavior from the first to the second year of the project. The PEAK team provided participating institutions with regular reports detailing usage. We hypothesized that librarian decisions about purchasing access products for the second year (1999) might be consistent with a simple learning dynamic: increase expenditures on products under-purchased in 1998 and decrease expenditures on products they over-purchased in 1998. For each institution we compared the direction of 1998-99 expenditure change for each access product to the change we hypothesized.[23] We present the results in Table 6.11.
Six of the nine institutions adjusted the number of generalized subscriptions in a manner consistent with our hypothesis.[24] Fewer adjusted traditional subscriptions in the predicted direction. Two of the seven institutions that purchased more traditional subscriptions in 1998 than was ex post optimal then decreased the number purchased in 1999. Indeed, only three of the eight institutions made any changes at all to their traditional subscription lineup. This suggests an inertia that cannot be explained solely by direct costs to the institution. Perhaps libraries see a greater insurance value in having certain titles freely available through traditional subscriptions than from having generalized subscription tokens available that can be used on articles from any title. Generalized subscription tokens are also more expensive per article than traditional subscription prices, so the libraries are purchasing more potential usage with their budgets. Another explanation might be that libraries were more cautious about purchasing generalized subscriptions because it was a less familiar product.
| Independent variable | Coefficient (standard error) |
| Year 1999 | -35.7* |
| (9.3) | |
| Green | 54.6* |
| (10.0) | |
| Red | 53.3* |
| (8.1) | |
| Blue | 85.8* |
| (9.2) | |
| Sample Size | 24 |
| R2 | 0.85 |
We performed a regression analysis to assess the differences between apparent over-purchasing in 1998 and 1999. Our dependent variable was the difference between the perfect forecast expenditure and actual expenditure, which we call the "forecast error". In Table 6.12 we report the effects of learning (the change in the error for 1999) and the average differences across experimental groups. The perfect foresight overspending over the life of the project averaged between 53% (Red) and 86% (Blue). However, the overspending was on average 36 percentage points lower in 1999. This represents a reduction of about one-half in perfect foresight overspending.[25]
We also considered other control variables, such as the institution's level of expenditures, fraction of the year participating in the experiment and number of potential users, but their contribution to explaining the forecast error was not statistically significant. The between-group variation and the 1999 improvement account for about 85% of the variation, as measured by the R2 statistic.
Decisions about specific titles
In addition to comparing the total number of subscriptions for an institution with the optimal number, we can also identify the optimality for each particular title subscribed. We calculate, based on observed usage and prices, which titles an institution with perfect foresight should have obtained through traditional subscriptions, and call this the optimal set. Then we calculate two measures of actual behavior. First, we determine which titles in the optimal set an institution actually purchased. Second, we determine which traditional subscription titles the institution would have been better off foregoing because actual access would have been less expensive using other available access products.
In Table 6.13 we present our analysis of the traditional subscription titles selected by institutions. There is wide variation both in the percent of purchased subscriptions that are in the optimal set, and in the percent of journals in the optimal set to which the institution did not subscribe,[26] Overall, there is substantial opportunity for improvement. This is not a criticism of institutional decisions. Rather, it indicates the opportunity for improved purchasing decisions if libraries obtain the type of detailed usage information PEAK provided.
We do generally see better decisions in 1999. However, in both years a rather large percentage of subscribed journals were not accessed at all.
| Institution | Year | Total subscriptions | Percent subscribed that are in optimal set | Percent of optimal set that were not subscribed | Percent of subscriptions accessed at least once |
| 3 | 1998 | 907 | 53.3% | 3.4% | 92.5% |
| 10 | 1998 | 23 | 0.0% | 100.0% | 65.2% |
| 11 | 1998 | 663 | 3.6% | 0.0% | 84.5% |
| 12 | 1998 | 22 | 0.0% | 100.0% | 81.8% |
| 13 | 1998 | 205 | 0.5% | 0.0% | 12.7% |
| 14 | 1998 | 72 | 0.0% | N/A | 36.1% |
| 15 | 1998 | 102 | 0.0% | N/A | 48.0% |
| 3 | 1999 | 907 | 75.0% | 7.7% | 97.0% |
| 10 | 1999 | 23 | 13.0% | 76.9% | 65.2% |
| 13 | 1999 | 205 | 29.8% | 62.6% | 86.8% |
| 14 | 1999 | 72 | 0.0% | N/A | 20.8% |
| 15 | 1998 | 102 | 10.8% | 8.3% | 84.3% |
Dynamic Optimal Choice
Access product purchasing decisions made by institutions have a profound impact on the costs faced by users, and thus on the realized demand for access. Therefore, in deciding what access products, electronic or otherwise, to purchase, an institution must not only consider the demand realized for a particular level of user cost, but also what would be demanded at differing levels of user costs. Likewise, in our determination of the optimal bundle of access products, we should not take the given set of accesses as fixed and exogenous. As a simple example, let us assume that a subscription to a given journal requires 25 accesses in order to pay for itself. Now assume that the institution in question did not subscribe to that journal, and that 20 tokens were used to access articles in the time period. At first look, it appears as though the institutions did the optimal thing. Let us assume, however, that we know that accesses would increase by 50%, to 30, when no password is required. It now appears as though the institution should have subscribed, since the reduced user costs would stimulate sufficient demand to justify these higher costs.
| Institution | Year | Trad. Subscriptions | Addit. Articles | Increase | Total | ||
| Actual Optimal | Rescaled Optimal | Actual Optimal | Rescaled Optimal | Optimal Cost | Access Increase | ||
| 3 | 1998 | 500 | 556 | 1099 | 1130 | 9.39% | 12.53% |
| 3 | 1999 | 737 | 805 | 236 | 146 | 4.85% | 7.46% |
| 11 | 1998 | 24 | 31 | 2532 | 3019 | 21.11% | 21.09% |
| 12 | 1998 | 1 | 1 | 254 | 287 | 17.76% | 13.67% |
| 14 | 1999 | 0 | 0 | 168 | 249 | 48.21% | 48.21% |
| 15 | 1999 | 12 | 17 | 242 | 366 | 47.56% | 60.36% |
In Table 6.4 we reported results that allow us to estimate how much usage would increase if no passwords or other user costs were incurred. We now calculate the product purchases that would have optimally matched the usage demand that we estimate would have occurred had the library removed or absorbed all user costs. We report the results in Table 6.14.[27] For most institutions, the optimal number of journal subscriptions increases, because greater usage makes the subscription more valuable. In general, the estimated institution cost of the optimal bundle would not increase greatly to accommodate the usage increase that would follow from eliminating user costs. Although we cannot quantify a dollar value for the eliminated user costs (because they include nonpecuniary costs such as those from requiring a password), we show in the last two columns that the modest institutional cost increase would be accompanied by comparable or larger increases in usage. The greatest cost increase (48%) occurs for the institutions (14 and 15) at which generalized subscription tokens were not available and the institution did not directly subsidize the per-article fee, i.e. at those institutions where users faced the highest user costs. Thus, the higher institutional costs should be weighed against high savings in user costs (including money spent on per-article purchases).
6.7 Conclusion
Experience from the early years of electronic commerce indicates that low user costs—nonpecuniary as well as pecuniary—are critical to the success of electronic distribution systems. In the PEAK experiment, we have evidence that for the information goods in question, these non-pecuniary costs are of the same magnitude as significant pecuniary costs. In a two-tiered decision problem such as in this project, where intermediaries determine the user costs required to access specific content, both the quantity and composition of demand is greatly affected by users' reactions to these costs. Therefore any determination of what the intermediary "ought" to do must take these effects into account. Furthermore, we have initial evidence that suggests that users who come to expect information at zero marginal cost are far less likely to pay these non-monetary costs when requested than their counterparts who expect these costs. This finding is of great import to both those who design electronic information delivery and pricing systems as well as any intermediaries controlling information access and costs.
In the second part of the chapter we investigated the extent to which libraries could have improved their purchasing decisions if they had detailed usage information that provided a reliable basis for forecasting future usage. We found that with perfect foresight about next year's usage, libraries could have substantially reduced their expenditures. They could also have substantially improved the match between what titles they purchased and what articles users want to access.
We then linked the two sets of analyses by showing how much greater usage would be if the library absorbed or removed the pecuniary and non-pecuniary user costs we observed. The result would be substantial increases in usage. The library expenditures would have to increase by comparable percentage amounts; however the institution should recognize that these costs would be offset by the lower user costs incurred by its constituents, and the net cost, if any, would support substantial increases in usage.
Notes
1. See MacKie-Mason and Riveros (2000) for a discussion of the economics of electronic publishing.![]()
2. See Bonn et al. (this volume) and Hunter (this volume) for accounts of the genesis of this project.![]()
3. Kingma (this volume) provides a
good discussion of the role of library as intermediary.![]()
4. As we further discuss below, user cost may include several components only one of which is a standard price. The other components may include, for example, time and inconvenience. We expect these user costs, taken together, and not price alone, to determine usage.![]()
5. 120 is the approximate average number of articles in a traditional printed journal for a given year. We refer to this bundle of options to access articles as a set of tokens, with one token used for each article added to the generalized subscription during the year.![]()
6. For example, a Green institution first decides how many generalized subcriptions to purchse (if any). Users then access articles using generalized subscription "tokens" at zero pecuniary cost until the tokens run out, and thereafter pay a fee per article for additional articles. The library determines how many articles (not which articles) are available at the two different prices.![]()
7. To access PEAK from other IP addresses, users entered a password. Once access was granted, all content in these categories was available without further user cost.![]()
8. In the first eight months of the experiment, users paid with a First Virtual VPIN account, rather than with a credit card. Because a VPIN was an unfamiliar product, the non-pecuniary costs were probably higher than for credit card usage, although formally the user needed to undertake the same steps.![]()
9. When the user accessed an article for which per-article payment was required, the institution was automatically billed by the PEAK service.![]()
10. Paid content is metered content not including article in journals to which an institution purchased a traditional subscription.![]()
11. Formally, Normalized Paid Access is equal to  , where Apaid is the total number of paid accesses, Aunmetered the total number of unmetered accesses, and Scale is equal total number of free accesses divided by the total number of accesses of free content in journals to which the institution does not have a traditional subscription. We multiply by Scale because the more that accesses are covered by traditional subscriptions, the less likely a user is to require paid access. Scaling by access to unmetered content also controls for different overall usage intensity (due to different numbers of active users, differences in the composition of users, differences in research orientation, differences in user education about PEAK, etc.). Unmetered accesses proxies for the number of user sessions, and therefore our statistic is an estimate of paid accesses per session.
![]()
12. Only 28% of unmetered accesses from Red group users were password authenticated. This suggests that a large majority of users attempting to access paid content would not already be password authenticated. For these users, the need to password authenticate would truly be a marginal cost.![]()
13. The Elsevier journal catalogue is especially strong in these subject areas, so we expect differences in usage when the subject area concentration of the user community differs.![]()
14. In only two cases were credit cards are required, and both were at the same institution.![]()
15. Recall that all users at an institution could access, without password authentication, any article previously purchased by that institution with a generalized token. For articles purchased on a per-article basis, only the individual who purchased the article could view it without further monetary cost.![]()
16. The libraries at institutions 3 and 11 processed these requests electronically, through PEAK, while the library at institution 9 did not and thus incurred greater processing delays.![]()
17. In addition, institution 6 is a corporate institution. It is possible that its users' budgetary constraints were not as binding as those associated with academic institutions.![]()
18. This phenomenon was widely discussed—though not, to our knowledge, sufficiently demonstrated—during the early years of widespread public access on the Internet. Many businesses and commentators asked whether users would pay for any content after being accustomed to getting most Internet-delivered information for free.![]()
19. For an excellent discussion of the collection development officer's problem, see Haar (1999)![]()
20. The percentage of articles read through June 1999 for academic institutions participating in PEAK ranged from .12% to 6.40%. An empirical study by King and Griffiths (1995) found that about 43.6% of users who read a journal read five or fewer articles from the journal and 78% of the readers read 10 or fewer articles.![]()
21. Project implementation delays exacerbated the demand forecasting problem. For example, none of the institutions in the Blue Group started the project until the third quarter of the year.![]()
22. With print publications and some electronic products libraries may be willing to spend more on full journal subscriptions to create complete archival collections. All access to PEAK materials ended in August 1999, however, so archival value should not have played a role in decision making.![]()
23. As 1999 PEAK access is for 8 months, the number of 1999 generalized subscriptions was multiplied by 1.5 for comparison with 1998.![]()
24. One of the institutions that increased token purchases despite over purchasing in 1998 was more foresightful than our simple learning model: its usage increased so much that it ran out of tokens less than six months into the final eight-month period of the experiment.![]()
25. E.g., the Green group had average overspending of about 55% so a 36-point change represents a shift from about 73% in 1998 to about 37% in 1999.![]()
26. The calculations in the two columns are independent and should not generally sum to one. The first column indicates the percent of titles that were subscribed that should have been subscribed (given perfect foresight). A high percent means there were not many specific titles subscribed that should not have been. However, this does not indicate that a library subscribed to most of the titles that it should have. A library that subscribes to zero journals will get 100% on this measure: no journals were subscribed that should not have been. The second column addresses this question: what percent of those titles that should have been subscribed were missed? The two columns correspond to Type I and Type II error in classical statistical theory. The first should be high, and the second low if the institution is forecasting well (and following our simple model of "optimal" practice).![]()
27. We performed the calculation for those institutions for which we have a good estimate of the user cost effect (see Table 6.4), and for which there were enough article accesses for meaningful estimation.![]()