Economics and Usage of Digital Libraries: Byting the Bullet
Skip other details (including permanent urls, DOI, citation information): This work is protected by copyright and may be linked to without seeking permission. Permission must be received for subsequent distribution in print or electronically. Please contact mpub-help@umich.edu for more information.
For more information, read Michigan Publishing's access and usage policy.
4.7 User demographics
In the PEAK project design, unmetered articles and articles covered by traditional subscriptions could be accessed by any user from a workstation associated with one of the participating sites (authenticated by the computer's IP address). If users wanted to use generalized subscription tokens or to purchase individual articles on a per-article basis they had to obtain a password and use it to authenticate.[10] We have more complete data on the subset of users who obtained and used passwords.
| Status | ||||||
| Division | Faculty | Staff | Graduate Student | Undergrad | Other | Total |
| Engineering, science and medicine | 408 | 214 | 1032 | 211 | 38 | 1903 |
| Architecture and urban planning | 103 | 11 | 47 | 16 | 19 | 196 |
| Education, business, information/library science and social science | 91 | 43 | 287 | 46 | 2 | 469 |
| Other | 178 | 240 | 350 | 176 | 34 | 978 |
| Total | 780 | 508 | 1716 | 449 | 93 | 3546 |
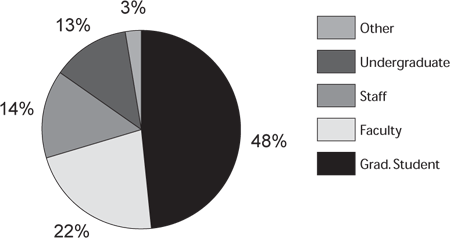
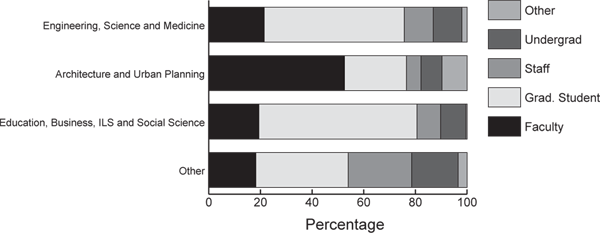
In Table 4.2 we report the distribution of the more than three thousand users who obtained passwords and who used PEAK at least once. Most of the users are from engineering, science and medicine, reflecting the strength of the Elsevier collection in these disciplines. 70% of these users were either faculty or graduate students (see Figure 4.1). The relative fractions of faculty and graduate students varies widely by discipline (see Figure 4.2). Our sample of password-authenticated users, while probably not representative of all electronic access usage, includes all those who accessed articles via either generalized subscription tokens or per-article purchase. It represents the interested group of users, who were sufficiently motivated to obtain and use a password. Gazzale and MacKie-Mason (this volume) discuss the effects of passwords and other user costs on user behavior.
In Table 4.3 we summarize usage of PEAK through August 1999. Authorized users joined the system gradually over the first nine months of 1998. There were 208,104 different accesses to the content in the PEAK system over 17 months.[11] Of these, 65% were accesses of unmetered material (not-full-length articles, plus all 1998 accesses to content published pre-1997, and all 1999 accesses to pre-1998 content).[12] However, one should not leap to the conclusion that users will access scholarly material much less when they have to pay for it, though surely that is true to some degree. To correctly interpret the "free" versus "paid" accesses we need to account for three effects. First, to users much of the metered content appeared to be free: the libraries paid for the traditional subscriptions and the generalized subscription tokens. Second, the quantity of unmetered content in PEAK was substantial: on day one, approximately January 1, 1998, all 1996 content and some 1997 content was in this category. On January 1, 1999, all 1996 and 1997 content and some 1998 content was in this category. Third, the nature of some unmetered content (for example, letters and announcements) is different from metered articles, which might also contribute to usage differences.
| Treatment group | ||||
| Access Type | Green | Red | Blue | All Groups |
| Unmetered | 24632 | 96658 | 13911 | 135201 |
| Traditional subscription articles | ||||
| 1st use | N/A | 27140 | 2881 | 30021 |
| 2nd or higher use | N/A | 11914 | 597 | 12511 |
| Generalized subscription articles | ||||
| 1st use | 8922 | 9467 | N/A | 18389 |
| 2nd or higher use | 3535 | 4789 | N/A | 8324 |
| Individually purchased articles | ||||
| 1st use | 194 | 75 | 3192 | 3461 |
| 2nd or higher use | 108 | 26 | 63 | 197 |
| Total accesses | 37391 | 150069 | 20644 | 208104 |
Generalized subscription "tokens" were used to purchase access to 18,389 specific articles ("1st use"). These articles were then distinctly accessed an additional 8,324 times ("2nd or higher use"), for an average of 1.45 accesses per generalized subscription article. Traditional subscription articles had an average of 1.42 accesses per article. A total of 3461 articles were purchased individually on a per-article basis; these were accessed 1.06 times per-article on average. The difference in the number of accesses per article for articles obtained by generalized subscription and by per-article purchase is likely due to the difference in who may access the article after initial purchase. All authorized users at a site could access an article once it has been purchased with a generalized subscription token, while only the individual making a per-article purchase has the ability to re-access that article. Thus, we estimate that for individually purchased articles (whether by generalized subscription token or per-article purchase), the initial reader accessed the articles 1.06 times, and additional readers accessed these articles 0.39 times. That is, there appears on average at least one-third additional user per article under the more lenient access provisions of a generalized subscription token.
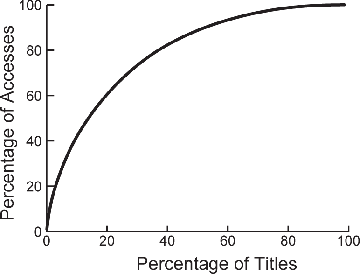
In Figure 4.3 we show a curve that reveals the concentration of usage among a relatively small number of Elsevier titles. We sorted articles that were accessed from high to low in terms of how often they were accessed. We then determined the smallest number of articles that, together, comprised a given percentage of total accesses, and counted the number of journal titles from which these articles were drawn. For example, 37% of the 1200 Elsevier titles generated 80% of the total accesses. 40% of the total accesses were accounted for by only about 10% of the journal titles.
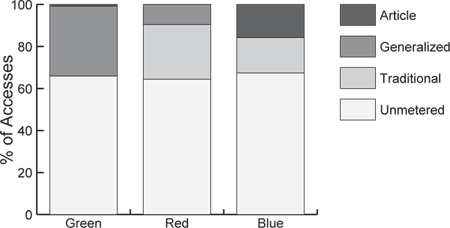
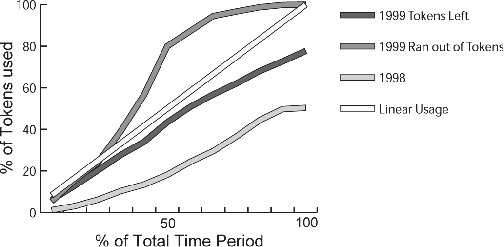
In Figure 4.4 we compare the fraction of accesses within each treatment group that are accounted for by traditional subscriptions, generalized subscriptions and per-article purchases. Recall that the Green and Blue groups only had two of the three access options.[13] When institutions had the choice of purchasing generalized subscription tokens, their users purchased essentially no access on a per-article basis. Of course, this makes sense as long as tokens are available: it costs the users nothing to use a token, but it costs real money to purchase on a per-article basis. Indeed, our data indicate that institutions that could purchase generalized subscription tokens tended to purchase more than enough to cover all of the demand for articles by their users; i.e., they didn't run out of tokens in 1998. We show this in aggregate in Figure 4.5: only about 50% of the tokens purchased for 1998 were in fact used. Institutions that did not run out of tokens in 1999 appear to have done a better job of forecasting their token demand for the year (78% of the tokens purchased for 1999 were used). Institutions that ran out of tokens used about 80% of the tokens available by around the beginning of May.
Articles in the unmetered category constituted about 65% of use across all three groups, regardless of which combination or quantity of traditional and generalized subscriptions an institution purchased. The remaining 35% of use was paid for with a different mix of options depending on the choices available to the institution. Evidently, none of the priced options choked off use altogether.
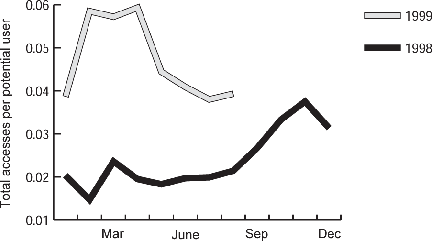
We show the total number of accesses per potential user for 1998 and 1999 in Figure 4.6. We divide by potential users (the number of people authorized to use the computer network at each of the participating institutions) because different institutions joined the experiment at different times. This figure thus gives us an estimate of learning and seasonality effects in usage. Usage per potential user was relatively low and stable for the first 9 months. However, it then increased to a level nearly three times as high over the next 9 months. We expect that this increase was due to more users learning about the existence of PEAK and becoming accustomed to using it. Note also that the growth begins in September 1998, the beginning of a new school year with a natural bulge in demand for scholarly articles. We also see pronounced seasonal effects in usage: local peaks in March, November and April.
To see the learning effect without interference from the seasonal effect, we calculated usage by type of access in the same three months (March-May) of 1998 and 1999; see Table 4.4. Overall, usage increased 167% from the first year to the second.
| 1998 | 1999 | Percentage Change | |
| Unmetered | 19291 | 55745 | 189% |
| Traditional | 6374 | 10560 | 66% |
| 1st Token | 1648 | 4805 | 192% |
| 1st per-article purchase | 1 | 1288 | N/A |
| 2nd or higher Token | 3060 | 8166 | 167% |
| 2nd or higher per-article purchase | 8 | 472 | 5800% |
| Total | 30382 | 81036 | 167% |
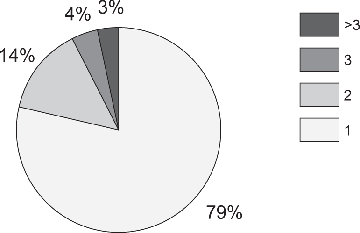
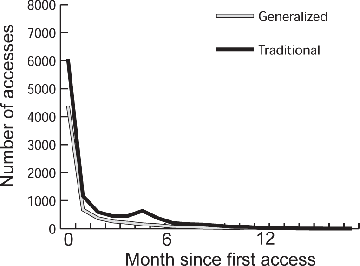
We considered the pattern of repeat accesses distributed over time. In Figure 4.7 we show that about 93% of articles accessed were accessed no more than two times. To further study repeat accesses, we selected only those articles (7%) that were accessed three or more times between January 1998 and August 1999 (high use articles). We then counted the number of times they were used in the first month after the initial access, the second month after, and so forth; see Figure 4.8. What we see is that almost all access to even high use articles occurred during the first month. After that, a very low rate of use persisted for about seven more months, then faded out altogether. Thus, we see that, even among the most popular articles, recency was very important.
Although recency appears to be quite important, we saw in Table 4.1 that over 60% of total accesses were for content in the unmetered category, most of which was over one year old. Although we pointed out that the monetary price to users for most non-unmetered articles was still zero (if accessed via institution-paid traditional or generalized subscriptions), there were still higher user costs for much of the more recent usage. If a user wanted to access an article using a generalized subscription token, then she had to obtain a password, remember it (or where she put it) and use it. If the article was not available in a traditional subscription and no tokens were available, then she had to do the above plus pay for the article with hard currency. Therefore, there are real user cost differences between the unmetered and metered content. The fact that usage of the older, unmetered content is so high, despite the clear preference for recency, supports the notion that users respond strongly to costs of accessing scholarly articles.[14]

