
Sports Culture Among Undergraduates: A Study of Student Athletes and Students at the University of Michigan
Skip other details (including permanent urls, DOI, citation information): This work is protected by copyright and may be linked to without seeking permission. Permission must be received for subsequent distribution in print or electronically. Please contact [email protected] for more information.
For more information, read Michigan Publishing's access and usage policy.
MEN AND WOMEN
On the night of June 8th, 2005, the University of Michigan became the first college east of the Mississippi ever to win the NCAA World Series of college softball. As Jennie Ritter and the Michigan women dueled with two-time defending champions UCLA in a gripping, extra-innings Game 3 in Oklahoma City, back in Ann Arbor a crowd of about twenty gathered at a well-known Ann Arbor sports bar to follow the contest on ESPN. This was not a bad turnout, given that the game occurred on a weeknight during summer vacation. One of the authors of this study, David Smith, was among those present, and something struck him as surprising—of the twenty who had come to the bar that night to watch this event in women’s sporting event, nineteen were men.
This seemed to be solid and prima facie confirmation of something that is widely known—that men are more “into sport” than women. But this knowledge needs some closer examination. Although most people would probably report from personal experience that men watch more sport, get more excited by it and know much more about it, few would be able do so with reference to any hard data to substantiate their anecdotes. Indeed, there is are few data available that contain such information, and we are pleased now to be able to present some. Even so, careful examination of these data shows that the matter is not so clear cut.
Attendance
One of the questions in our survey was how many hours a week students spent attending live sporting events. It may be surprising to see that there is very little difference here between women and men. In fact, the difference is not statistically significant:
| Gender | Mean | 95% Confidence Interval | Number of Respondents |
|---|---|---|---|
| Male | 3.0 | 2.6–3.4 | 361 |
| Female | 2.7 | 2.3–3.1 | 400 |
It seems reasonable to assume that the sporting events most of the students had in mind when responding to this question were college sporting events, as, living in Ann Arbor, these would be the main events that students would have the opportunity to attend (around 40% of students reported that they had no access to a car). Although there are many disparities between men and women in their consumption of sports, these numbers powerfully illustrate that attending college sports—especially, we suggest, attending football games at the University of Michigan—is a vital ceremony for students regardless of gender. Attending Michigan football games is a ritual of college life on campus that very few University of Michigan undergraduates permit themselves to miss, even if they are not particularly interested in football of any sort. Going to a Michigan game thus says very little about any Michigan student’s involvement with sports culture of any kind and at any level. Our numbers also suggest that under the right circumstances, women enjoy watching sports just as much as men, but the circumstances under which they enjoy it seem to be narrower, on average, than the circumstances under which men enjoy watching sports.
The importance of Michigan’s athletic reputation
The ritual of watching college sports, which involves the formation of deep, lifelong loyalties, is something that has to be experienced to be appreciated. As an illustration of this, to gauge how students felt about college sports before they got to college, we asked them on a scale of 1 to 7 how much “the history of Michigan’s athletic reputation” influenced their decision to come to Michigan. For non-athletes, the average male score is about 4.1 and the average female score 3; this difference is statistically significant:
| Gender | Mean (on 1–7 scale) | 95% Confidence Interval | Number of Respondents |
|---|---|---|---|
| Male | 4.1 | 3.8–4.4 | 189 |
| Female | 3.0 | 2.7–3.2 | 221 |
For athletes, among whom we would expect more convergence on this question, the difference is still statistically significant:
| Gender | Mean (on 1–7 scale) | 95% Confidence Interval | Number of Respondents |
|---|---|---|---|
| Male | 5.4 | 5.2–5.6 | 208 |
| Female | 4.7 | 4.5–4.9 | 223 |
The fact that there is a significant gender difference among athletes here is important. We might expect that athletes, regardless of gender, would attach similar levels of importance to the athletic reputation of the college they choose to attend. This cultural difference between men and women, however, is apparently so strong that we observe it even where we would least expect to find it—among athletes.
Involvement at sporting events
Women tend not to get as noisily involved at sporting events, at least not in their own estimation. One survey question asked “On a scale from 1-7, how involved are you at a sporting event (i.e. scream with profanity, argue with refs, participate in cheers, etc.” 1 was “very quiet” and 7 was “very noisy”. This table gives the complete distribution of answers, and shows that men consider themselves to be noisier at sporting events:
| Gender | 1 (Very Quiet) | 2 | 3 | 4 | 5 | 6 | 7 (Very Noisy) | Mean |
|---|---|---|---|---|---|---|---|---|
| Male | 17 | 41 | 51 | 65 | 99 | 61 | 50 | 4.48 |
| Female | 12 | 54 | 73 | 116 | 112 | 51 | 16 | 4.11 |
The difference in means is statistically significant here, and we can also observe that fewer women place themselves in the highest registers.
Watching televised sports
Now we turn our attention to the world of sports beyond the campus. The most typical way in which an American experiences sports is by watching them on television. Although various TV networks cover college sports extensively, the greater overall focus is on professional sports, and even a student who only watched college sports on television would more than likely be watching teams other than those of his or her own college. Students’ consumption of televised sports, then, is a measure of their engagement with the broader culture of American sports, over and above the sports experiences of college life. Our data make it obvious that men are much more engaged in this culture than women. On average, men watch about eight hours of sport on television per week, while women watch just over three. This difference is large and significant:
| Gender | Mean | 95% Confidence Interval | Number of Respondents |
|---|---|---|---|
| Male | 8.0 | 7.2–8.9 | 384 |
| Female | 3.2 | 2.0–3.6 | 418 |
Discussing sports
Another important feature of the broader sports culture is discussion of sports. One question asked students which level of sports they discussed most—college, professional, high school or other. The overall response is that 67% discuss college sport the most while 32% do so with professional sport. As about half the members of our sample are college athletes whom we would naturally expect to spend more time discussing college than professional sport, to make general inferences about college students we should look at the non-athlete sample. Here we find that 51.5% discuss college sports the most and 36.5% discuss professional sports the most. Breaking this group down by gender, we find that more non-athlete males discuss college sports than professional sports, (though this lead is not statistically significant), while non-athlete females discuss college sports more than professional sports at a rate of more than two to one.
This, of course, testifies yet again that this phenomenon is part of these women's college experience, not of their sports culture. The cultural “space” that female students make for sports in their lives is far more likely, therefore, to be directly related to their college experience than that of men, who show equal or more interest in non-college sports. Once again, it may be useful to look at the athlete sample because we would expect less difference from athletes on this question. Overall, athletes are indeed more likely to discuss college sports rather than professional sports the most, at 81% to 27% respectively. Breaking this group down by gender, we find the difference to be more, rather than less, pronounced: over 91% of female athletes discuss college sports the most, while the figure for male athletes is 69%. This lends some evidence to the notion that women “do” sports whereas men “follow” them. Knowing and following a team such as the Detroit Lions shows a commitment to the broader American sports culture that does not necessarily come with following the University of Michigan’s football team. The following table summarizes all of these results, and their relevant confidence intervals:
| Group |
% College
(with Confidence Interval)
|
% Professional
(with Confidence Interval)
| Number of Respondents |
|---|---|---|---|
| Overall | 67.2 (63.9–70.4) | 32.8 (28.6–34.9) | 822 |
| Non-athletes | 51.6 (46.6–56.6) | 36.6 (31.8–41.4) | 388 |
| Male Non-athletes | 45.9 (38.5–53.2) | 49.7 (36.6–31.8) | 181 |
| Female Non-athletes | 56.3 (49.5–63.1) | 25.2 (19.3–31.2) | 206 |
| Athletes | 81.1 (77.4–84.8) | 27.4 (23.2–31.6) | 434 |
| Male Athletes | 69.9 (63.6–76.1) | 43.0 (36.3–49.8) | 209 |
| Female Athletes | 91.5 (87.8–95.2) | 12.5 (8.1–16.9) | 224 |
Logo clothing
A particularly intriguing aspect of sports culture is the wearing of logo clothing. The importance of logo clothing to the Michigan experience would be obvious to anyone who has been in Ann Arbor on a game day, or who has counted the number of shops in downtown Ann Arbor devoted solely to Michigan merchandise (at least five by our count). Michigan may well have marketed its logo clothing more effectively than any other college nationally—and beyond. David Smith, co-author of this study, remembers being bewildered, at the age of thirteen, when Michigan baseball caps arrived in stores in his hometown of Sydney, Australia. Although Australians had long been moderate consumers of the logo clothing of American professional teams, American college teams were unknown in Australia before Michigan merchandise first arrived in the early nineties.
A USA Today article documents the heady increase in revenues that the University enjoyed during this period, based largely on the success of Michigan’s highly influential basketball team of the early 1990s, the so-called Fab Five.
It is unsurprising, then, that nearly all Michigan students surveyed should report owning some collegiate logo clothing (the question did not specify which college, but it seems a fair assumption that most would own Michigan clothing). Men and women own collegiate logo clothing in about the same numbers. It is equally predictable that men own professional logo clothing at a substantially greater rate than women—this is consistent with our other data which suggest that men and women participate equally in the campus sports culture, but very differently in the broader sports culture.
| Gender | % Own Collegiate Clothing | % Own Professional Clothing | Number of Respondents |
|---|---|---|---|
| Male | 94.5 (92.2–96.8) | 83.2 (79.5–87.0) | 382 |
| Female | 92.5 (90.1–95.0) | 58.8 (54.2–63.5) | 430 |
More surprising are the responses on when and where students wear their logo clothing. While equally few men and women wear it as ordinary casual clothing (or never wear it at all), significantly more women than men wear logo clothing when watching televised games, and more women than men in our sample also wear logo clothing at live games (this difference is almost, but not quite, statistically significant):
| Gender | Never | As Ordinary Casual Wear | To Watch Televised Events | To Live Events |
|---|---|---|---|---|
| Male | 4.3% (2.3–6.3) | 15.1 (11.5–18.6) | 28.6 (24.2–33.1) | 30.4 (25.9–34.9) |
| Female | 4.7% (2.7–6.7) | 10.1 (7.7–13.4) | 39.1 (34.5–43.6) | 38.2 (33.7–42.7) |
What does this mean? Why are women more conspicuous wearers of logo clothing than men, though in nearly every other facet of sports culture they are less involved than men? We cannot make any general conclusions from our sample, but we may hypothesize that logo clothing, for women, with its distinctive team labels and colors, is a way of visually identifying themselves as fans. This is all the more important because women participate less than men in other areas of sports culture—especially, as we shall see, in accumulating trivia—and so may be considered “outsiders” within this culture.
Studies have shown that clothing is a crucial marker for out-groups to get accepted by in-groups. Clothing constitutes a very important outward marker of identifying with a group, an event—a culture—and it clearly signifies a sense of belonging. We also know that most out-groups tend to overcompensate when they try to gain access to in-groups precisely because their access is not taken for granted and is always frowned upon and viewed suspiciously by the insiders. Thus, to be accepted as equals by the already present group which, of course, completely defines all the terms of the discourse—to be genuinely regarded as “inside baseball” (to use an appropriate vernacular of American English, in which sports metaphors are more commonly used than in any other major language)—outsiders overcompensate on the terms demanded by insiders. Men’s fluency in the language of sports culture needs no outward affirmation. It is assumed by all. For women, however, this is not the case. Women still have to prove to men—and to themselves—that they, too, have acquired fluency in the language of sports culture. One signifier of that language is wearing sports paraphernalia. As is well known from Barry Levinson’s film “Diner”, in which the main protagonist will only marry his bride if she passes a detailed trivia test about the then still Baltimore Colts, men need constant proof from women that women are really serious about sports; that they pass the audition; that they have mastered the language so to speak. So women who care about learning the language of sports culture which is totally masculine and male dominated, overcompensate by wearing sports paraphernalia or other items that signify their arrival in this milieu. To make matters even harder for women, once they have in fact mastered this language, men diminish their achievement by labeling it “studied”—which is precisely what it is. But “studied” is not the real thing for any insiders, it is always used to delineate them from newcomers be it in sports or any other realm of social interaction.[17]
Knowledge
A final dimension of sports space is knowledge. Students were asked whether they could name members of the lineups of eight historical and contemporary teams from the four major professional sports: The 1950s and current New York Yankees, the 1960s and current Boston Celtics, the 1970s and current Pittsburgh Steelers, and the 1950s and current Detroit Red Wings. Adding all the answers together, we see that knowledge levels contain the single greatest difference between male and female students in their participation in sports culture: men, on average, could name a total of over ten players while women on average could name about two. Breaking down the questions into contemporary and historic lineups, we find that men could name three historic players on average, while the female average was .3, and that the male average for contemporary lineups was about 7.2, and for women was 1.7.
| Team | Male Mean | Female Mean | Total Mean |
|---|---|---|---|
| 1950s Yankees | 1.11 (0.99–1.23) | 0.17 (0.12–0.22) | 0.61 (0.54–0.68) |
| 1960s Celtics | 0.52 (0.43–0.61) | 0.00 (0.00–0.01) | 0.25 (0.20–0.29) |
| 1970s Steelers | 0.89 (0.77–1.01) | 0.04 (0.02–0.07) | 0.44 (0.38–0.51) |
| 1950s Red Wings | 0.76 (0.64–0.87) | 0.14 (0.09–0.18) | 0.43 (0.37–0.49) |
| Total historic | 3.28 (2.94–3.61) | 0.35 (0.27–0.44) | 1.73 (1.54–1.92) |
| Contemporary Yankees | 2.14 (1.96–2.31) | 0.56 (0.46–0.65) | 1.30 (1.19–1.40) |
| Contemporary Celtics | 1.25 (1.12–1.39) | 0.11 (0.07–0.15) | 0.65 (0.57–0.73) |
| Contemporary Steelers | 1.66 (1.49 – 1.82) | 0.15 (0.10–0.21) | 0.86 (0.76–0.96) |
| Contemporary Red Wings | 2.17 (1.99–2.34) | 0.88 (0.75–1.00) | 1.48 (1.37–1.60) |
| Total Contemporary | 7.17 (6.64–7.70) | 1.69 (1.47–1.92) | 4.27 (3.93–4.60) |
| Total | 10.93 (9.64–11.22) | 2.04 (1.76–2.32) | 5.99 (5.59–6.48) |
The lineup that both male and female students knew best was unsurprisingly (given the location) the contemporary Detroit Red Wings, of whom men could name 2.2 on average, and women .9. The least-known lineup was the Boston Celtics of the 1960s, for which the average male and female scores were just .517 and .004 respectively.
Readers who may have been immersed in sports culture their entire lives, who would have no problem reeling off at least five members of each of the four historic teams, and who would consider it a personal failing not to be able to name every starter in the contemporary teams, may be surprised at the apparently low mean scores here. People who are intensely engaged in the broader sports culture are sometimes unaware that much of the population lead satisfied lives without ever knowing the name of a professional athlete. 261 out of our 845 respondents—including 129 athletes—did not give an answer to any of the questions. Fortunately, we have an immediate comparison available. In 2003, Markovits distributed the same survey to 329 student athletes at Harvard University. The results are presented in the following table:
| Team | Male Mean | Female Mean | Total Mean |
|---|---|---|---|
| 1950s Yankees | 1.28 (1.09–1.48) | 0.23 (0.13–0.34) | 0.80 (0.68–0.94) |
| 1960s Celtics | 0.82 (0.65–1.00) | 0.06 (0.00–0.12) | 0.48 (0.37–0.58) |
| 1970s Steelers | 1.05 (0.82–1.3) | 0.04 (0.00–0.09) | 0.59 (0.45–0.73) |
| 1950s Red Wings | 0.35 (0.25–0.45) | 0.04 (0.00–0.09) | 0.21 (0.15–0.27) |
| Total historic | 3.50 (2.97–4.05) | 0.38 (0.22–0.54) | 2.09 (1.74–2.43) |
| Contemporary Yankees | 2.66 (2.37–2.95) | 0.75 (0.58–0.92) | 1.83 (1.63–2.03) |
| Contemporary Celtics | 1.91 (1.67–2.14) | 0.57 (0.41–0.73) | 1.31 (1.15–1.47) |
| Contemporary Steelers | 1.70 (1.44–1.96) | 0.08 (0.03–0.13) | 0.97 (0.81–1.14) |
| Contemporary Red Wings | 1.63 (1.35–1.90) | 0.20 (0.08–0.31) | 0.99 (0.81–1.17) |
| Total contemporary | 7.90 (7.02–8.79) | 1.61 (1.28–1.94) | 5.11 (4.50–5.71) |
| Total | 11.41 (10.08–12.74) | 1.99 (1.55–2.42) | 7.19 (6.30–8.10) |
There is no statistically significant difference in the total scores between Michigan and Harvard students. A major parallel worth noting between these institutions is the gender discrepancy, which is similar at both. Another important factor to take into account, which will be revisited later, is the importance of geography. The Harvard students know significantly more about the Boston Celtics and the New York Yankees, while the Michigan students know significantly more about the Red Wings. There was no significant difference in knowledge of the Pittsburgh Steelers. Over half of the students in the Michigan sample are from Michigan, and a similar number of the Harvard sample are from the Northeast; we can quite sensibly assume that students are more likely to know about the professional teams of their home regions.
Favorite sports
We will conclude this section on gender differences by examining differences in the kinds of sports that men and women like. Students were asked their favorite sport to watch on television, their favorite to attend live, and their favorite to play.
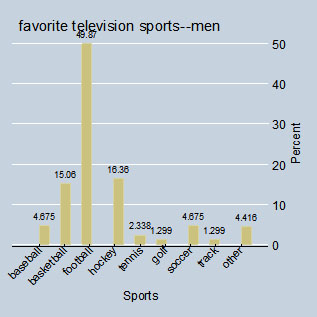
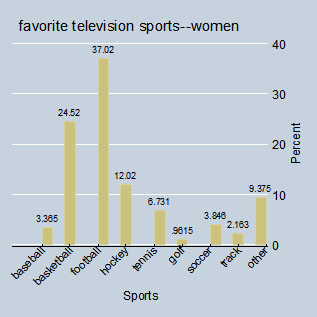
This graph shows the preferences of the whole sample:

For both men and women, the overwhelming television favorite is football, though in greater numbers for men than for women (44% to 32%). Football’s supremacy is all the more confirmed by the fact that the biggest athlete group at Michigan, the football players, did not even participate in the survey. More women than men list their favorite TV sport as basketball (23% to 14%), while men favor ice hockey in greater numbers than women (15% to 11%—bear in mind that we are in Michigan!) Baseball, which is not an ideal “television sport”, attains 4.2% and 3.3% for men and women respectively. Among women, tennis is a more popular television sport at 6.2% than is baseball, though baseball is more popular than tennis for men.
For both sexes, baseball trails soccer as a television sport, which finds 4.5% favor with men and 3.5% with women. Our finding about baseball is fascinating since baseball still continues to enjoy the sobriquet of being America’s “pastime” and remains—with football and basketball—the third member of the Big Three of America’s sports space. Our finding might also corroborate data that demonstrate soccer’s immense rise as a major activity among America’s youth coinciding with a stagnation, even decline (particularly among African Americans), in the playing and also the following of baseball. America’s second-biggest TV sport, NASCAR, gains just one (male) vote as a favorite television sport among Michigan students, putting it behind gymnastics, which gets 3.1% of the female vote and 1.2% of the male vote, and running, which records the same numbers. This would suggest that despite NASCAR’s massive nation-wide expansion over at least the last two decades, it remains at core a phenomenon with strong regional links to the South-East, and is geographically limited in the same way that the genuine ice hockey culture tends to be confined to the North.
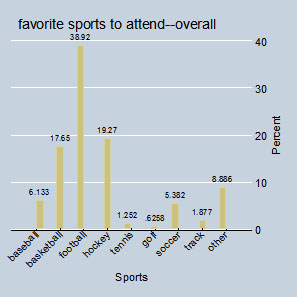
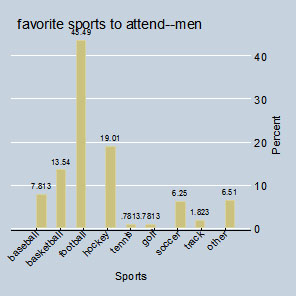
These patterns are roughly similar to those that emerge when students are asked their favorite sport to attend live. Football is still number one, and in about the same numbers for either gender (41% for men and 31% for women). Ice hockey remains prominent with both sexes as a live sport, with women listing it as their favorite sport almost in equal numbers to men (17.5% to 18.2%). Baseball also features good numbers as a live sport (8.2% for men and 4.2% for women) which places it slightly ahead of soccer for men and on a par with it for women (6% and 4.2%). There remains a large gap between women and men in favoring basketball as a live sport (20% to 11%).

Overall, about 61% of respondents list the same sport as their favorite both to watch on television and to attend live. It seems that men have a greater propensity to favor the same sport in both categories:
| Gender | Same Sport | Different Sport |
|---|---|---|
| Men | 64.3% (249) | 34.5% (131) |
| Women | 56% (224) | 44% (176) |
| Total | 60.7% (475) | 39.3% (307) |
A different picture emerges when we ask students which are their favorite sports to play. This graph shows the preferences of the whole sample:
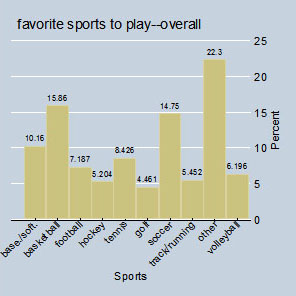
The high score of the “other” category largely reflects the presence of many athletes who do not play the big spectator sports, precisely those that comprise sports culture in society as a whole. When we remove the athlete component, we get a better idea of which recreational sports are more generally popular among students:
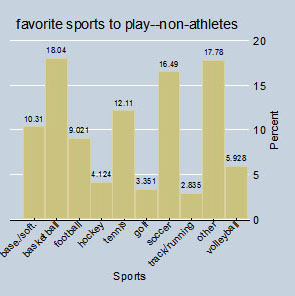
The supremacy of basketball, soccer and tennis are obvious here. Other interesting things to note, however, are the continued high position of football, which is relatively difficult to play as a pick-up game, and the low position of running, which, judging by Ann Arbor’s gyms and sidewalks, may well be the most common form of athletic activity among Michigan students.
Disaggregating this sample by gender, we get the following results:
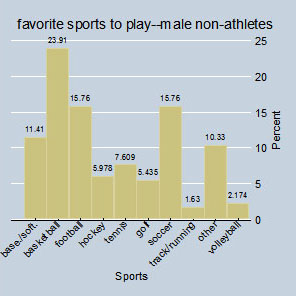
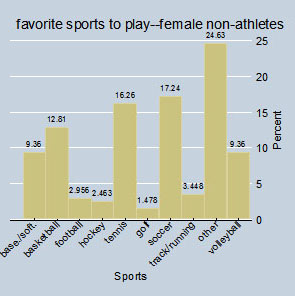
We have seen that about 40% of students named the same sport as their favorite to watch on TV and to watch live; relatively few nominate the same sport as their favorite to play and their favorite to watch, either live or on TV. In both cases, men are much more likely to name the same sport:
| Gender |
Same Sport
Percentage (Number)
|
Different Sport
Percentage (Number)
|
|---|---|---|
| Men | 29.4 (109) | 71.2 (270) |
| Women | 21.1 (84) | 78.9 (314) |
| Total | 75.1 (585) | 24.9 (194) |
| Gender |
Same Sport
Percentage (Number)
|
Different Sport
Percentage (Number)
|
|---|---|---|
| Men | 31.7 (120) | 68.3 (259) |
| Women | 22.9 (73) | 81.4 (319) |
| Total | 25.1 (194) | 74.9 (579) |
A total of 134 students (84 men and 50 women) name the same sport in all three categories.