The Forgotten Americans: A Visual Exploration of Lower Rio Grande Valley Colonias
Skip other details (including permanent urls, DOI, citation information): This work is licensed under a Creative Commons Attribution-NonCommercial-NoDerivatives 3.0 License. Please contact mpub-help@umich.edu to use this work in a way not covered by the license.
For more information, read Michigan Publishing's access and usage policy.
Abstract
Approximately 1.6 million people live in border communities called “colonias,” settlements along the U.S. side of the U.S.-Mexico border marked by inadequate housing and a dearth of basic services. Outside the auspices of local government, these informal settlements are home to the most impoverished households in the U.S.-Mexico border region. While much literature exists on colonias, we lack comprehensive data on their location and their susceptibility to environmental hazards. Intended as a pilot study, this research examines the United States Geological Survey Colonias Health, Infrastructure, and Platting Status (CHIPS) data set, cross-examining this frequently used data with grounded observations from qualitative interviews with colonias nonprofit directors (n = 5). While CHIPS elucidates various health and environmental issues associated with borderland colonias, it has several limitations. First, it miscounts colonias settlements, which causes severe underfunding for programs targeting colonias improvement. Second, because it does not capture the colonias with the greatest need, it creates a positive bias in federal colonias data, further exacerbating the funding issue. The study concludes with two avenues for further research: the need to update CHIPS to reflect the 2010s and the need to expand the definition of ‘colonia.’
Introduction
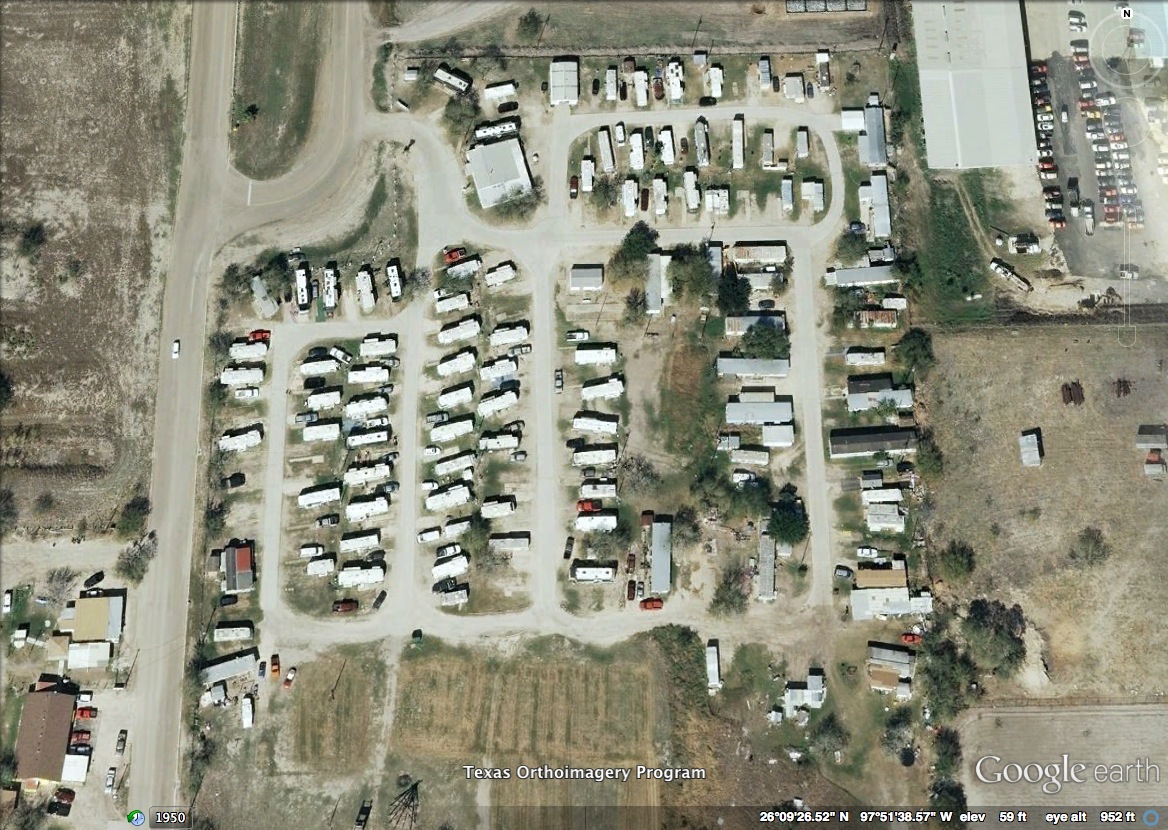
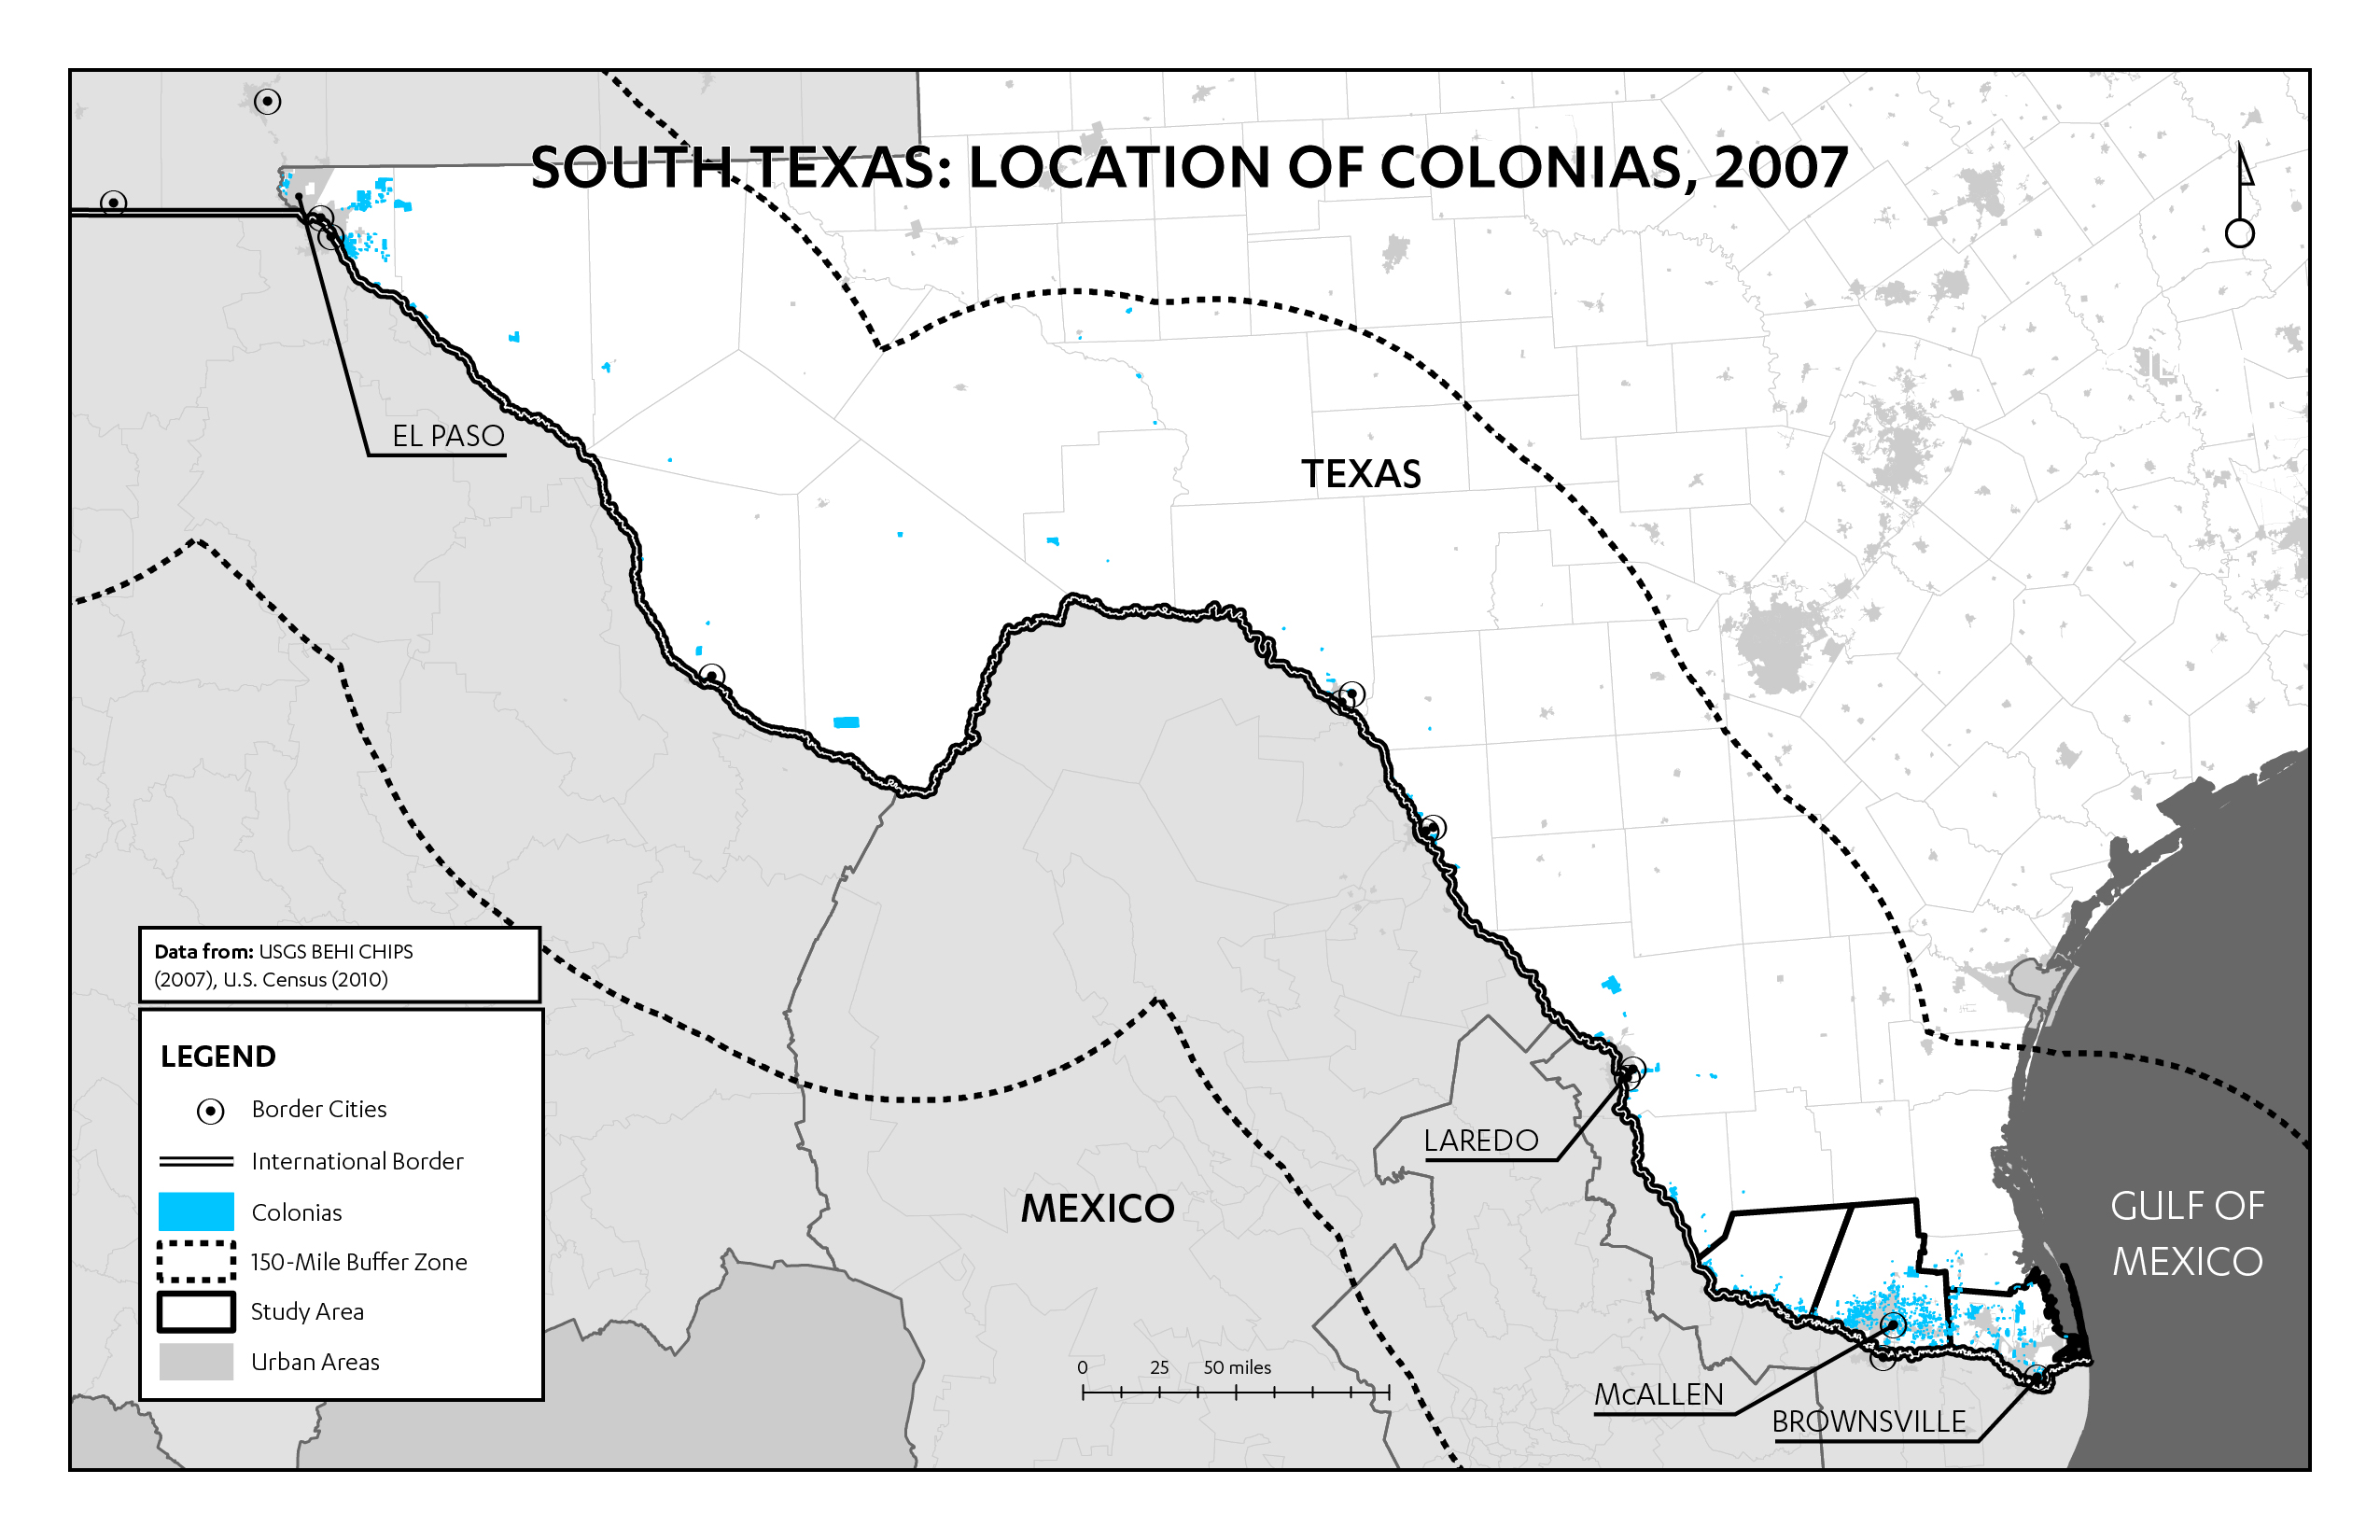
Self-labeled “The Forgotten Americans,” nearly 1.6 million people live along the United States (U.S.)-Mexico border in highly impoverished communities called “Las Colonias” (HAC 2013). The first colonias were developed in the 1960s as a result of the Bracero Program, which brought Mexican farmworkers to the U.S. to fill job shortages in agriculture (Ward 1999; Arizmendi, Arizmendi, and Donelson 2010). As these workers migrated to cities across Southern Texas, they encountered a severe shortage of affordable housing. Unscrupulous developers, capitalizing on this, illegally subdivided agriculturally unsuitable lands across unincorporated territories near major border cities (Figure 2 shows locations of colonias across Southern Texas). This allowed them to sell these lots to unsuspecting migrant farmworkers, who believed they were legally purchasing land. While residents were promised utilities, few developers kept this promise. Outside the auspices of local government and enforcement, this illegal activity continued unabated for nearly three decades. Numerous community-based organizations (CBOs), most religious, have since advocated for basic utilities and services in the colonias; through community organizing, they lobbied for basic representation and services (HAC 2005; Donelson 2004).
In 1989, journalist Peter Applebome published a highly influential story in The New York Times in which he called the colonias “one of the nation’s most wrenching public health problems” (1989: A12). This publicity, coupled with increasing pressures from CBOs, contributed to the federal recognition of colonias settlements in the 1990 Cranston-Gonzalez National Affordable Housing Act. Paraphrased here, the act defines a “recognized” colonia as:
- Within one of four border states (California, Arizona, New Mexico, or Texas);
- Within 150 miles of the border and not within a metropolitan statistical area with a population exceeding one million people;
- Designated as a colonia by the state and/or county it resides within;
- Determined to be a colonia because of lack of potable water, adequate sewage systems, and/or decent, safe, and sanitary housing;
- Recognized as a colonia prior to the Cranston-Gonzalez Act (S.566, 1989: SEC. 709).
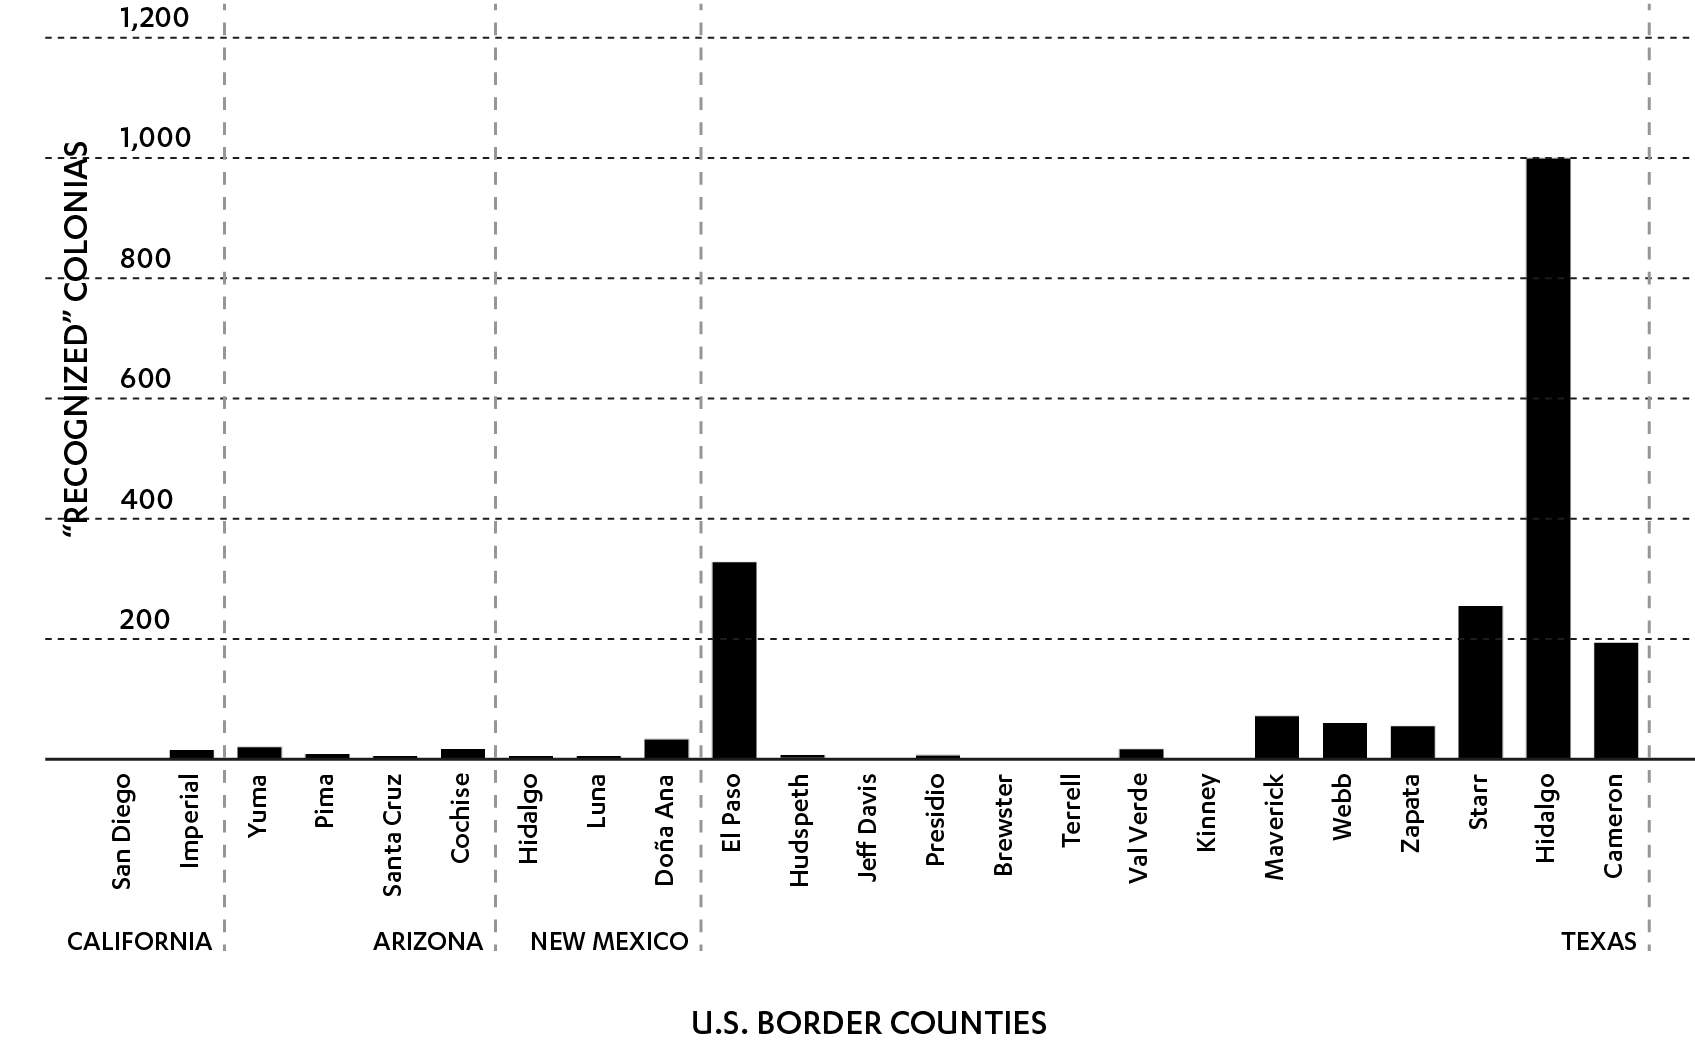
However, this definition excludes hundreds of colonias formed after 1990, which are not locally recognized for political reasons. For instance, Figure 3 shows that 990 colonias are located in Hidalgo County, Texas (CHIPS, 2007), but local organizations have identified over 1,200. The restrictiveness of the Cranston-Gonzalez Act definition consequently affects federal data collection. I argue that this omission may positively bias federal colonias data by leaving out the most at-risk settlements. This hypothesis emerges from a cross-analysis of federal colonias data and qualitative interviews with colonias nonprofit directors.
Data and Case Study
The main source of information on colonias conditions is the 2007 U.S. Geological Survey (USGS) Colonias Health, Infrastructure, and Platting Status (CHIPS) data set, which is widely used in colonias research. CHIPS was intended to replace an older, less accurate colonias data set for Southern Texas by adding new environmental variables and more precise GIS shapefiles. However, while CHIPS replaces an older dataset, it still has several shortcomings. This study cross-examines CHIPS data with preliminary findings from semi-structured interviews with nonprofit directors of self-help organizations in Hidalgo, Starr, and Cameron counties (n = 5). Preliminary results from these interviews highlight the inconsistencies between the CHIPS data set and grounded realities.
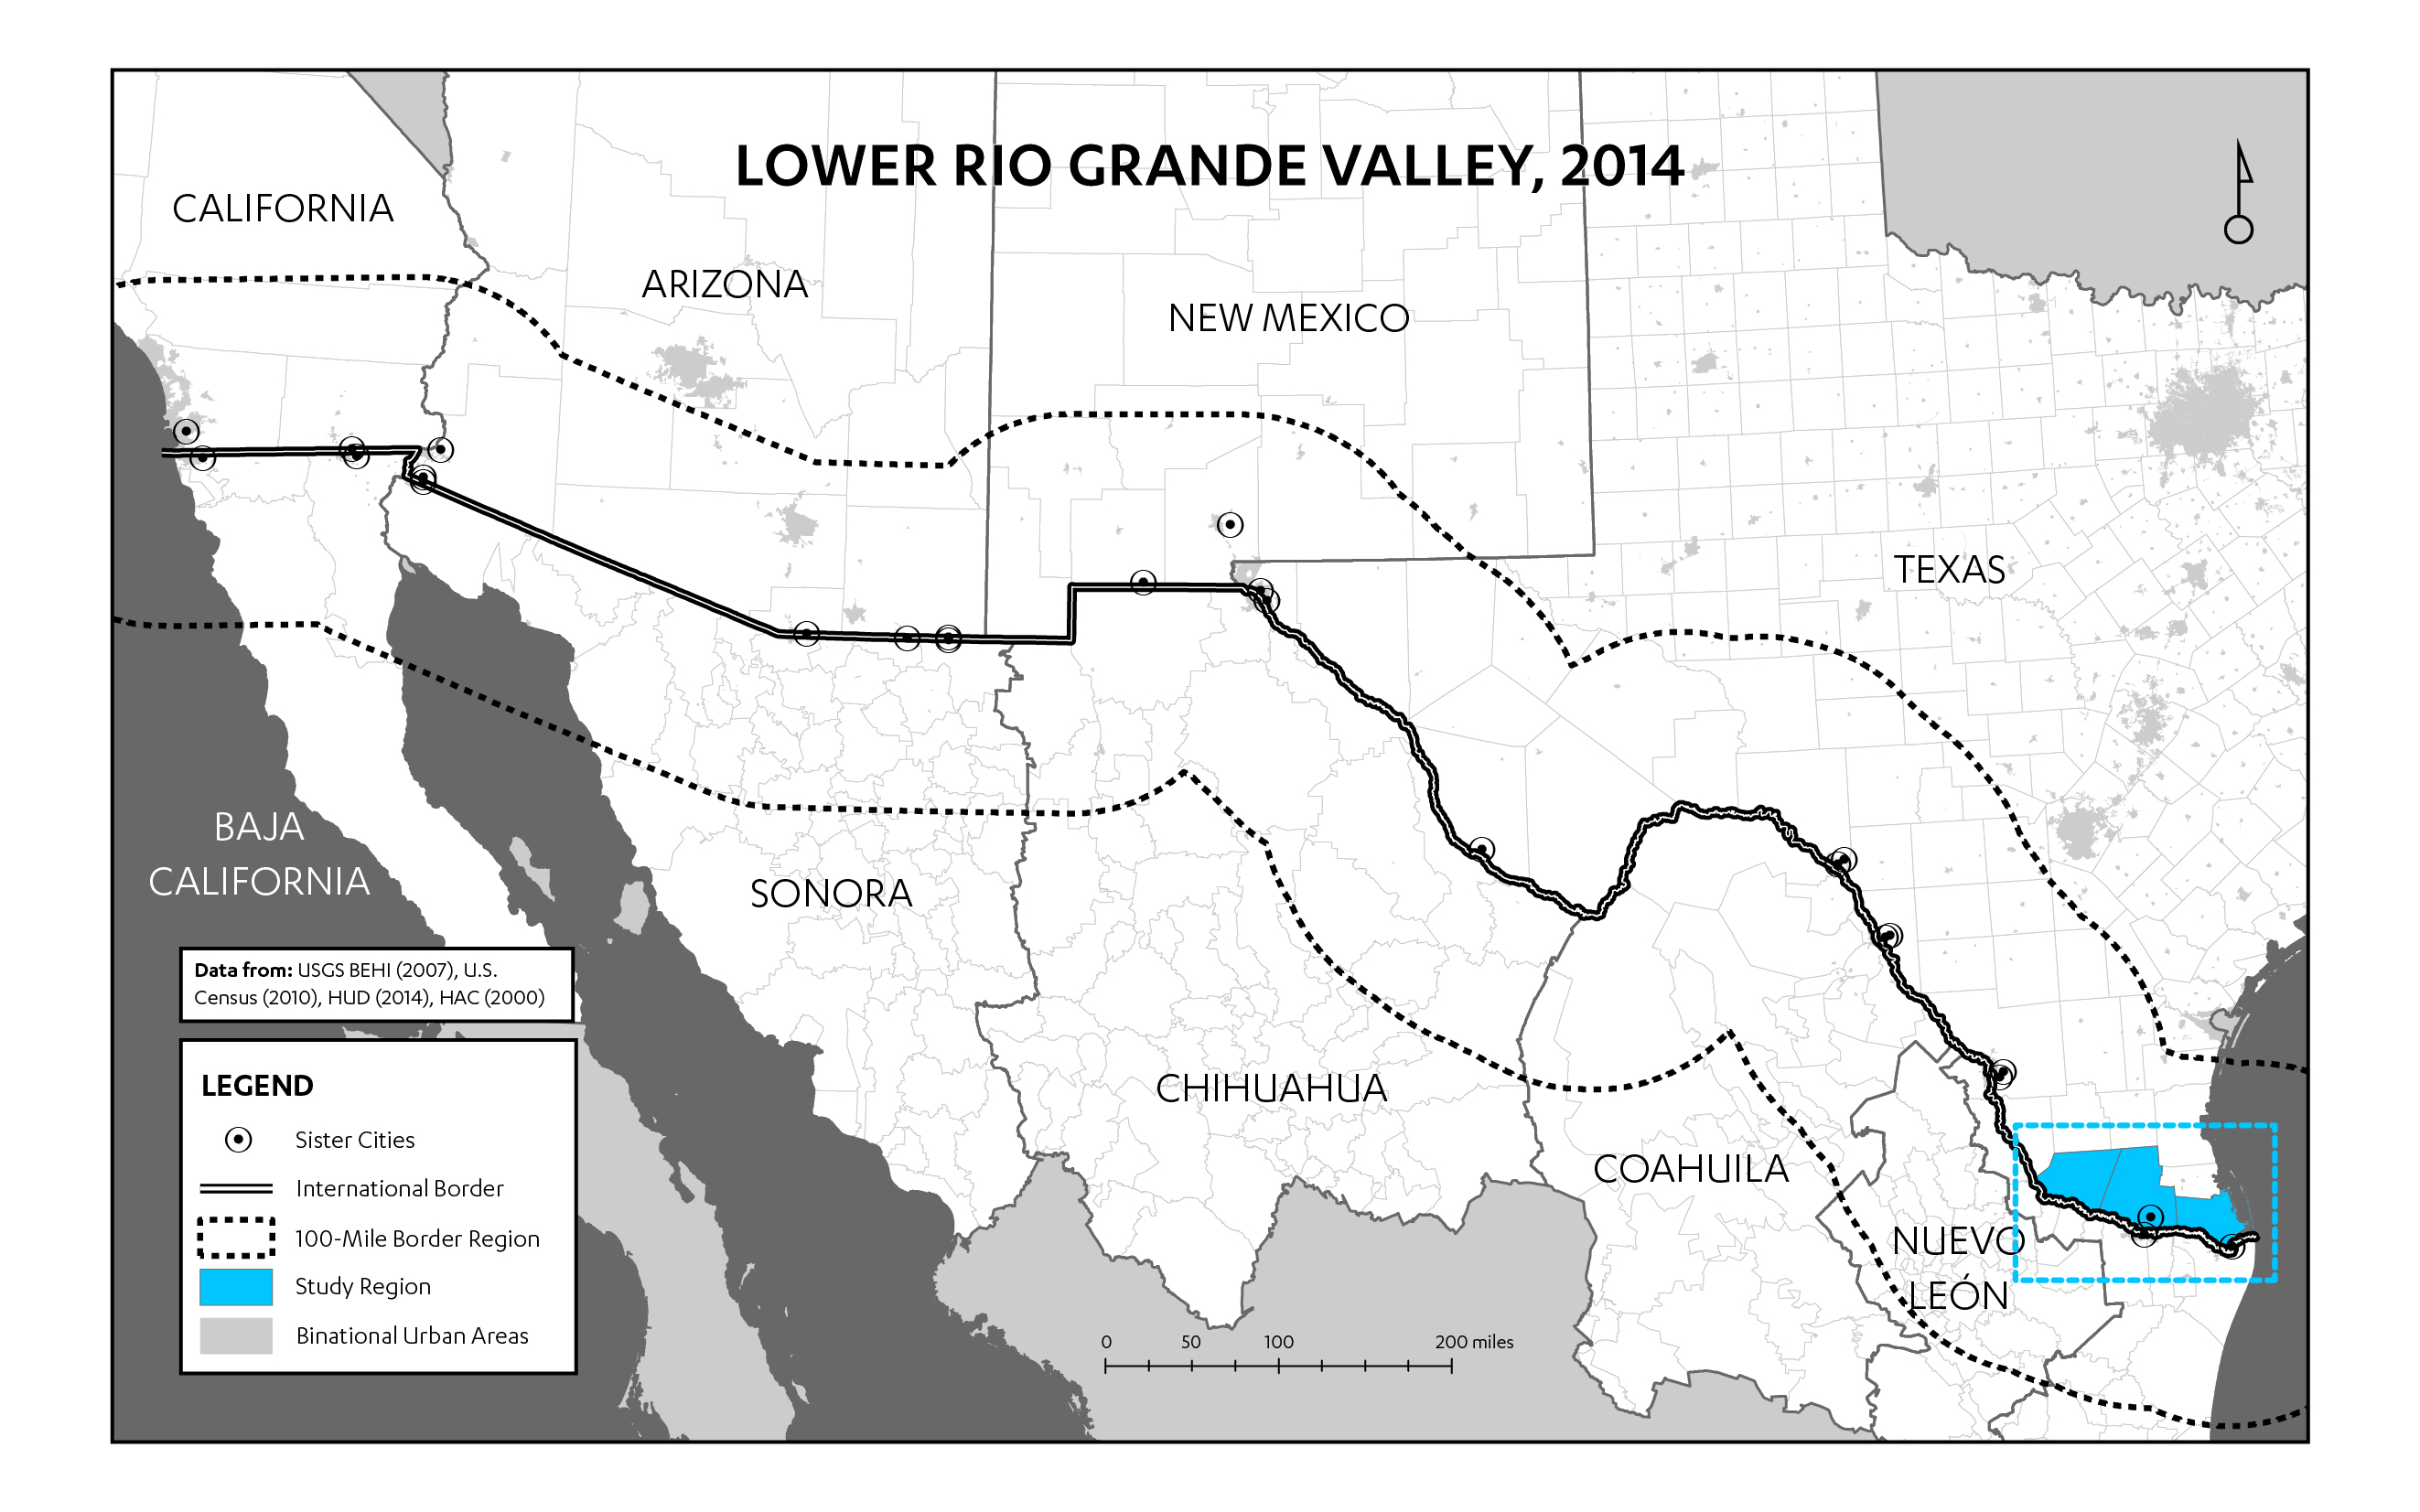
This analysis uses the three counties of the Lower Rio Grande Valley (Starr, Hidalgo, and Cameron Counties) to study these inconsistencies (Figure 4). Together, these counties contain 52 percent of all recognized borderland colonias (HUD 2014; Texas Secretary of State 2014). This region also hosts the majority of colonia improvement organizations: it is home to 56 percent of all colonias self-help housing nonprofits (HAC 2005).
Examining the CHIPS Data
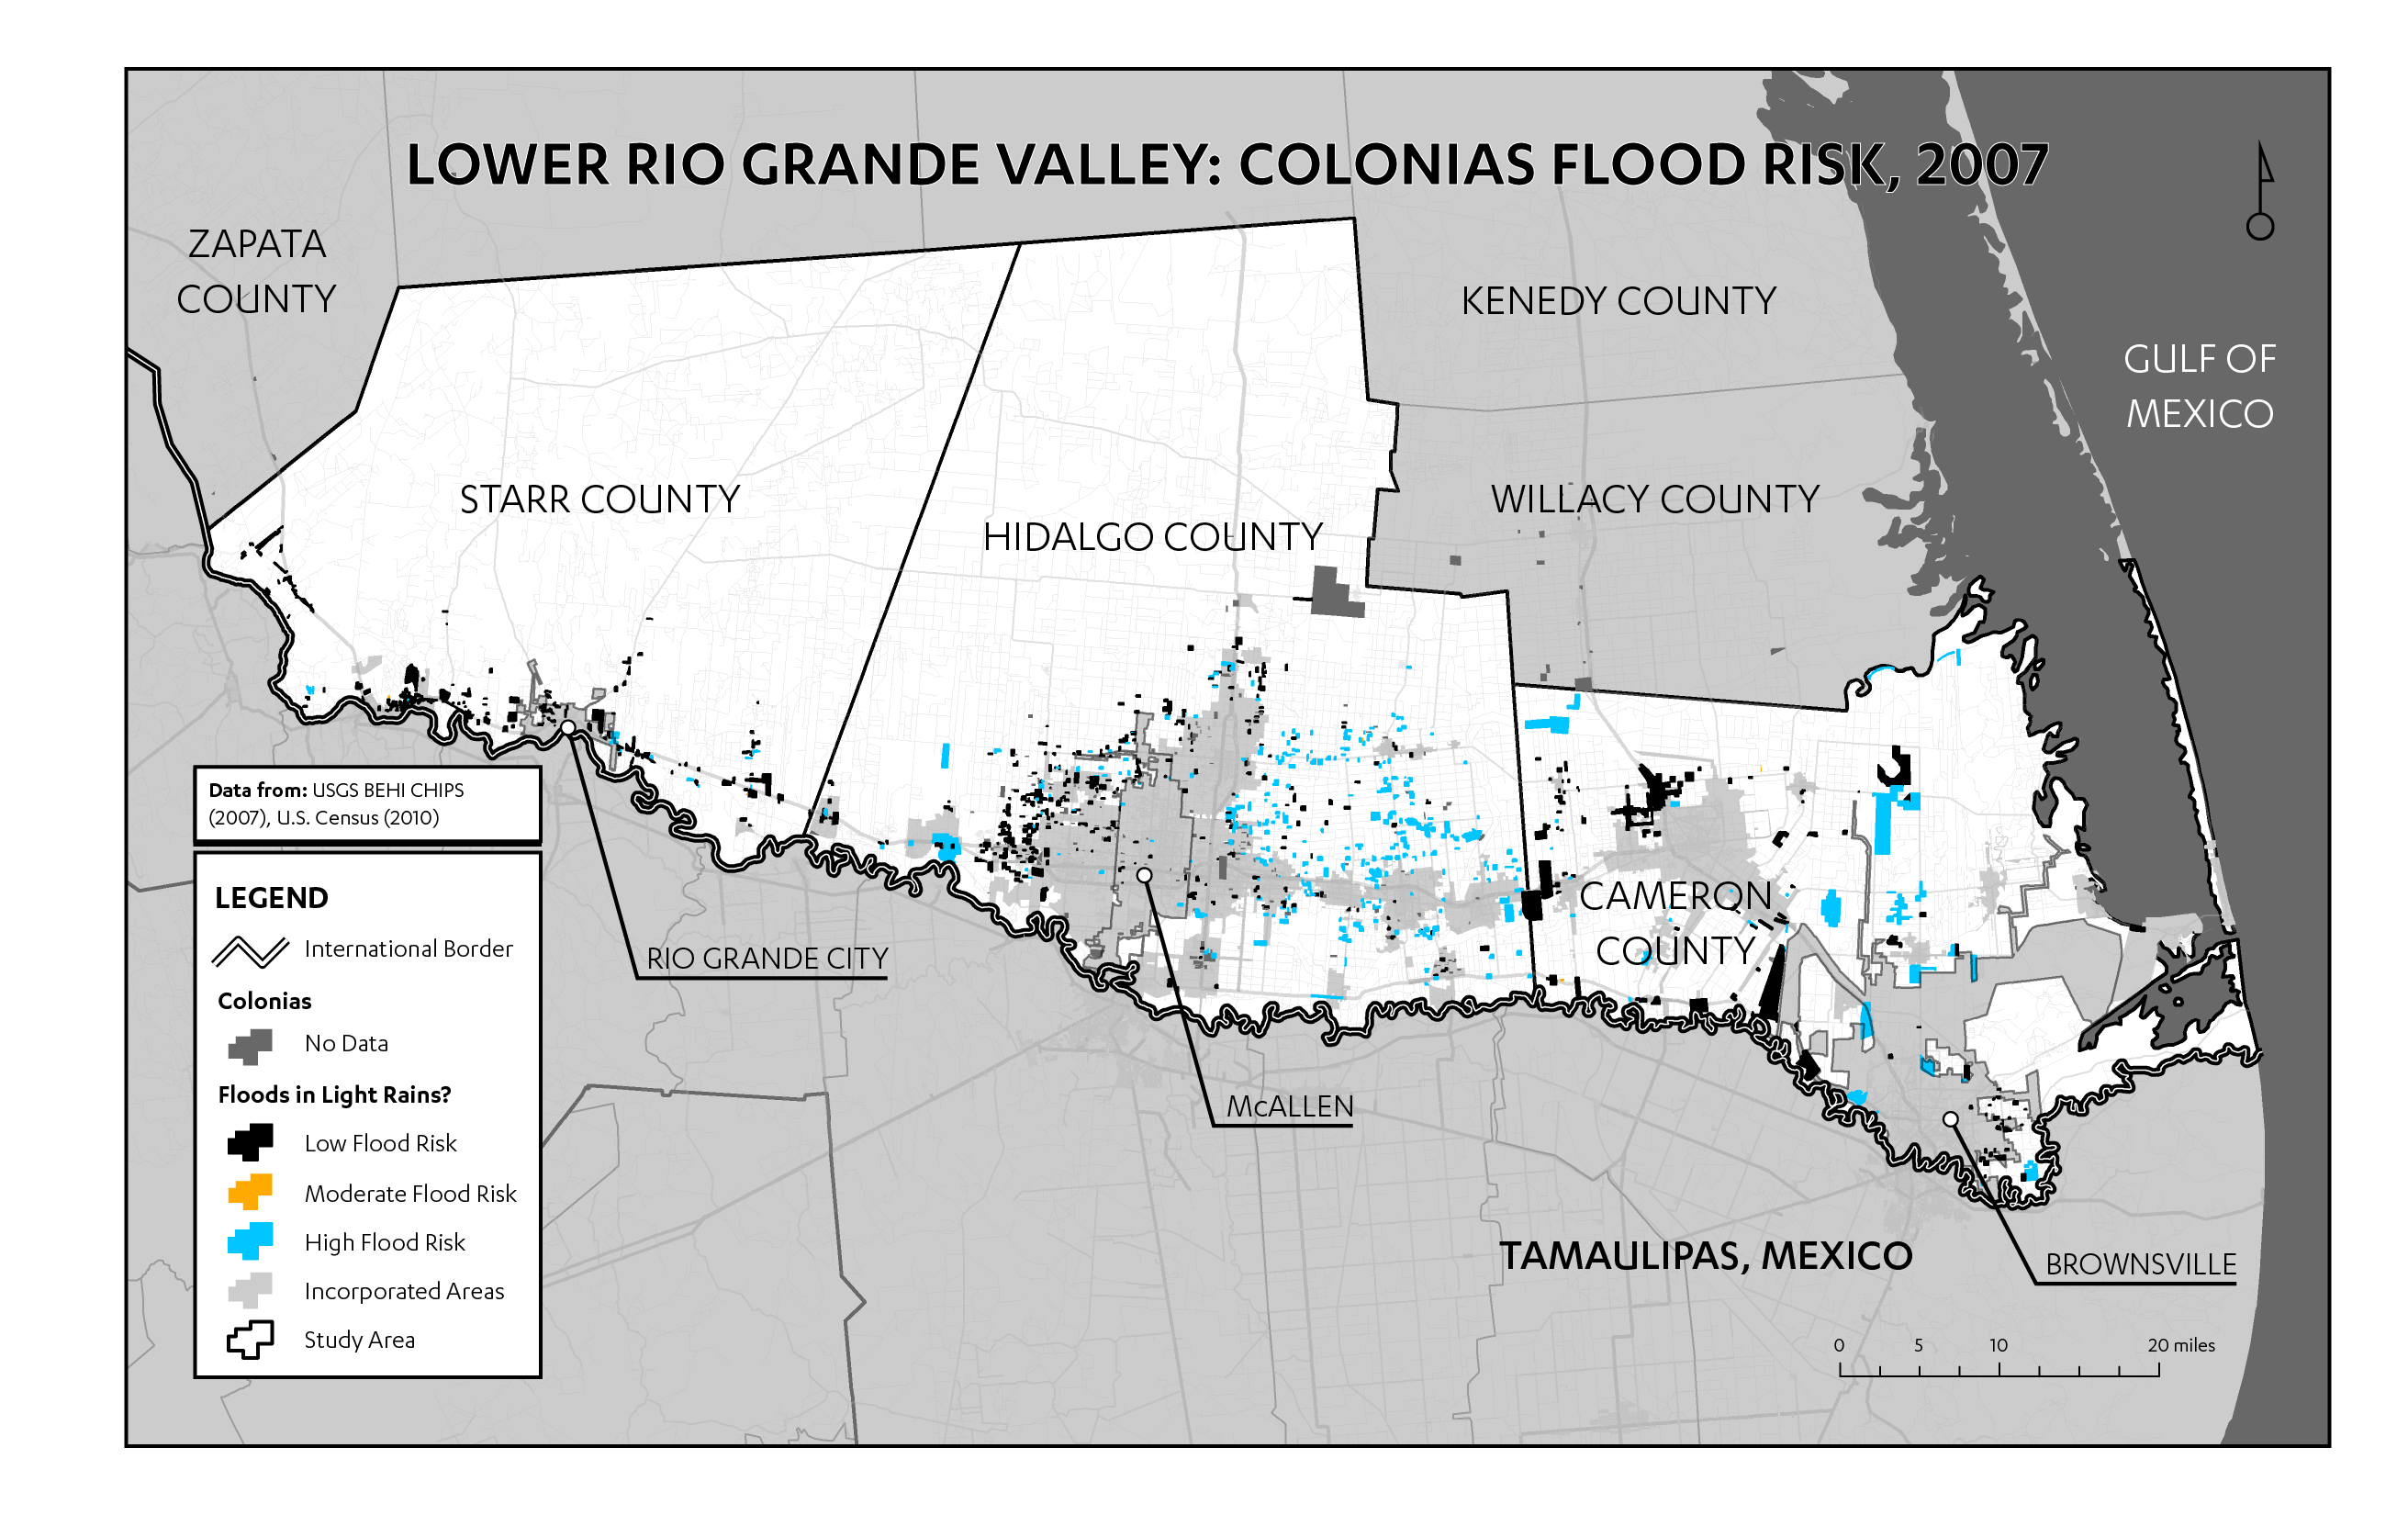
The overwhelming majority of colonias in the Lower Rio Grande Valley reside on severely flood-prone lands (USGS BEHI 2011). In even the lightest rainstorms, many colonias households flood, an issue compounded by the lack of stormwater systems. Figure 5 depicts the geography of flood vulnerability in the Lower Rio Grande Valley; the most vulnerable colonias are located east of McAllen, not coincidentally where the density of colonias is greatest. Additionally, vulnerability to flooding is dangerously exacerbated during hurricanes (Figure 5). CHIPS helps to determine which colonias are most vulnerable to violent storms.
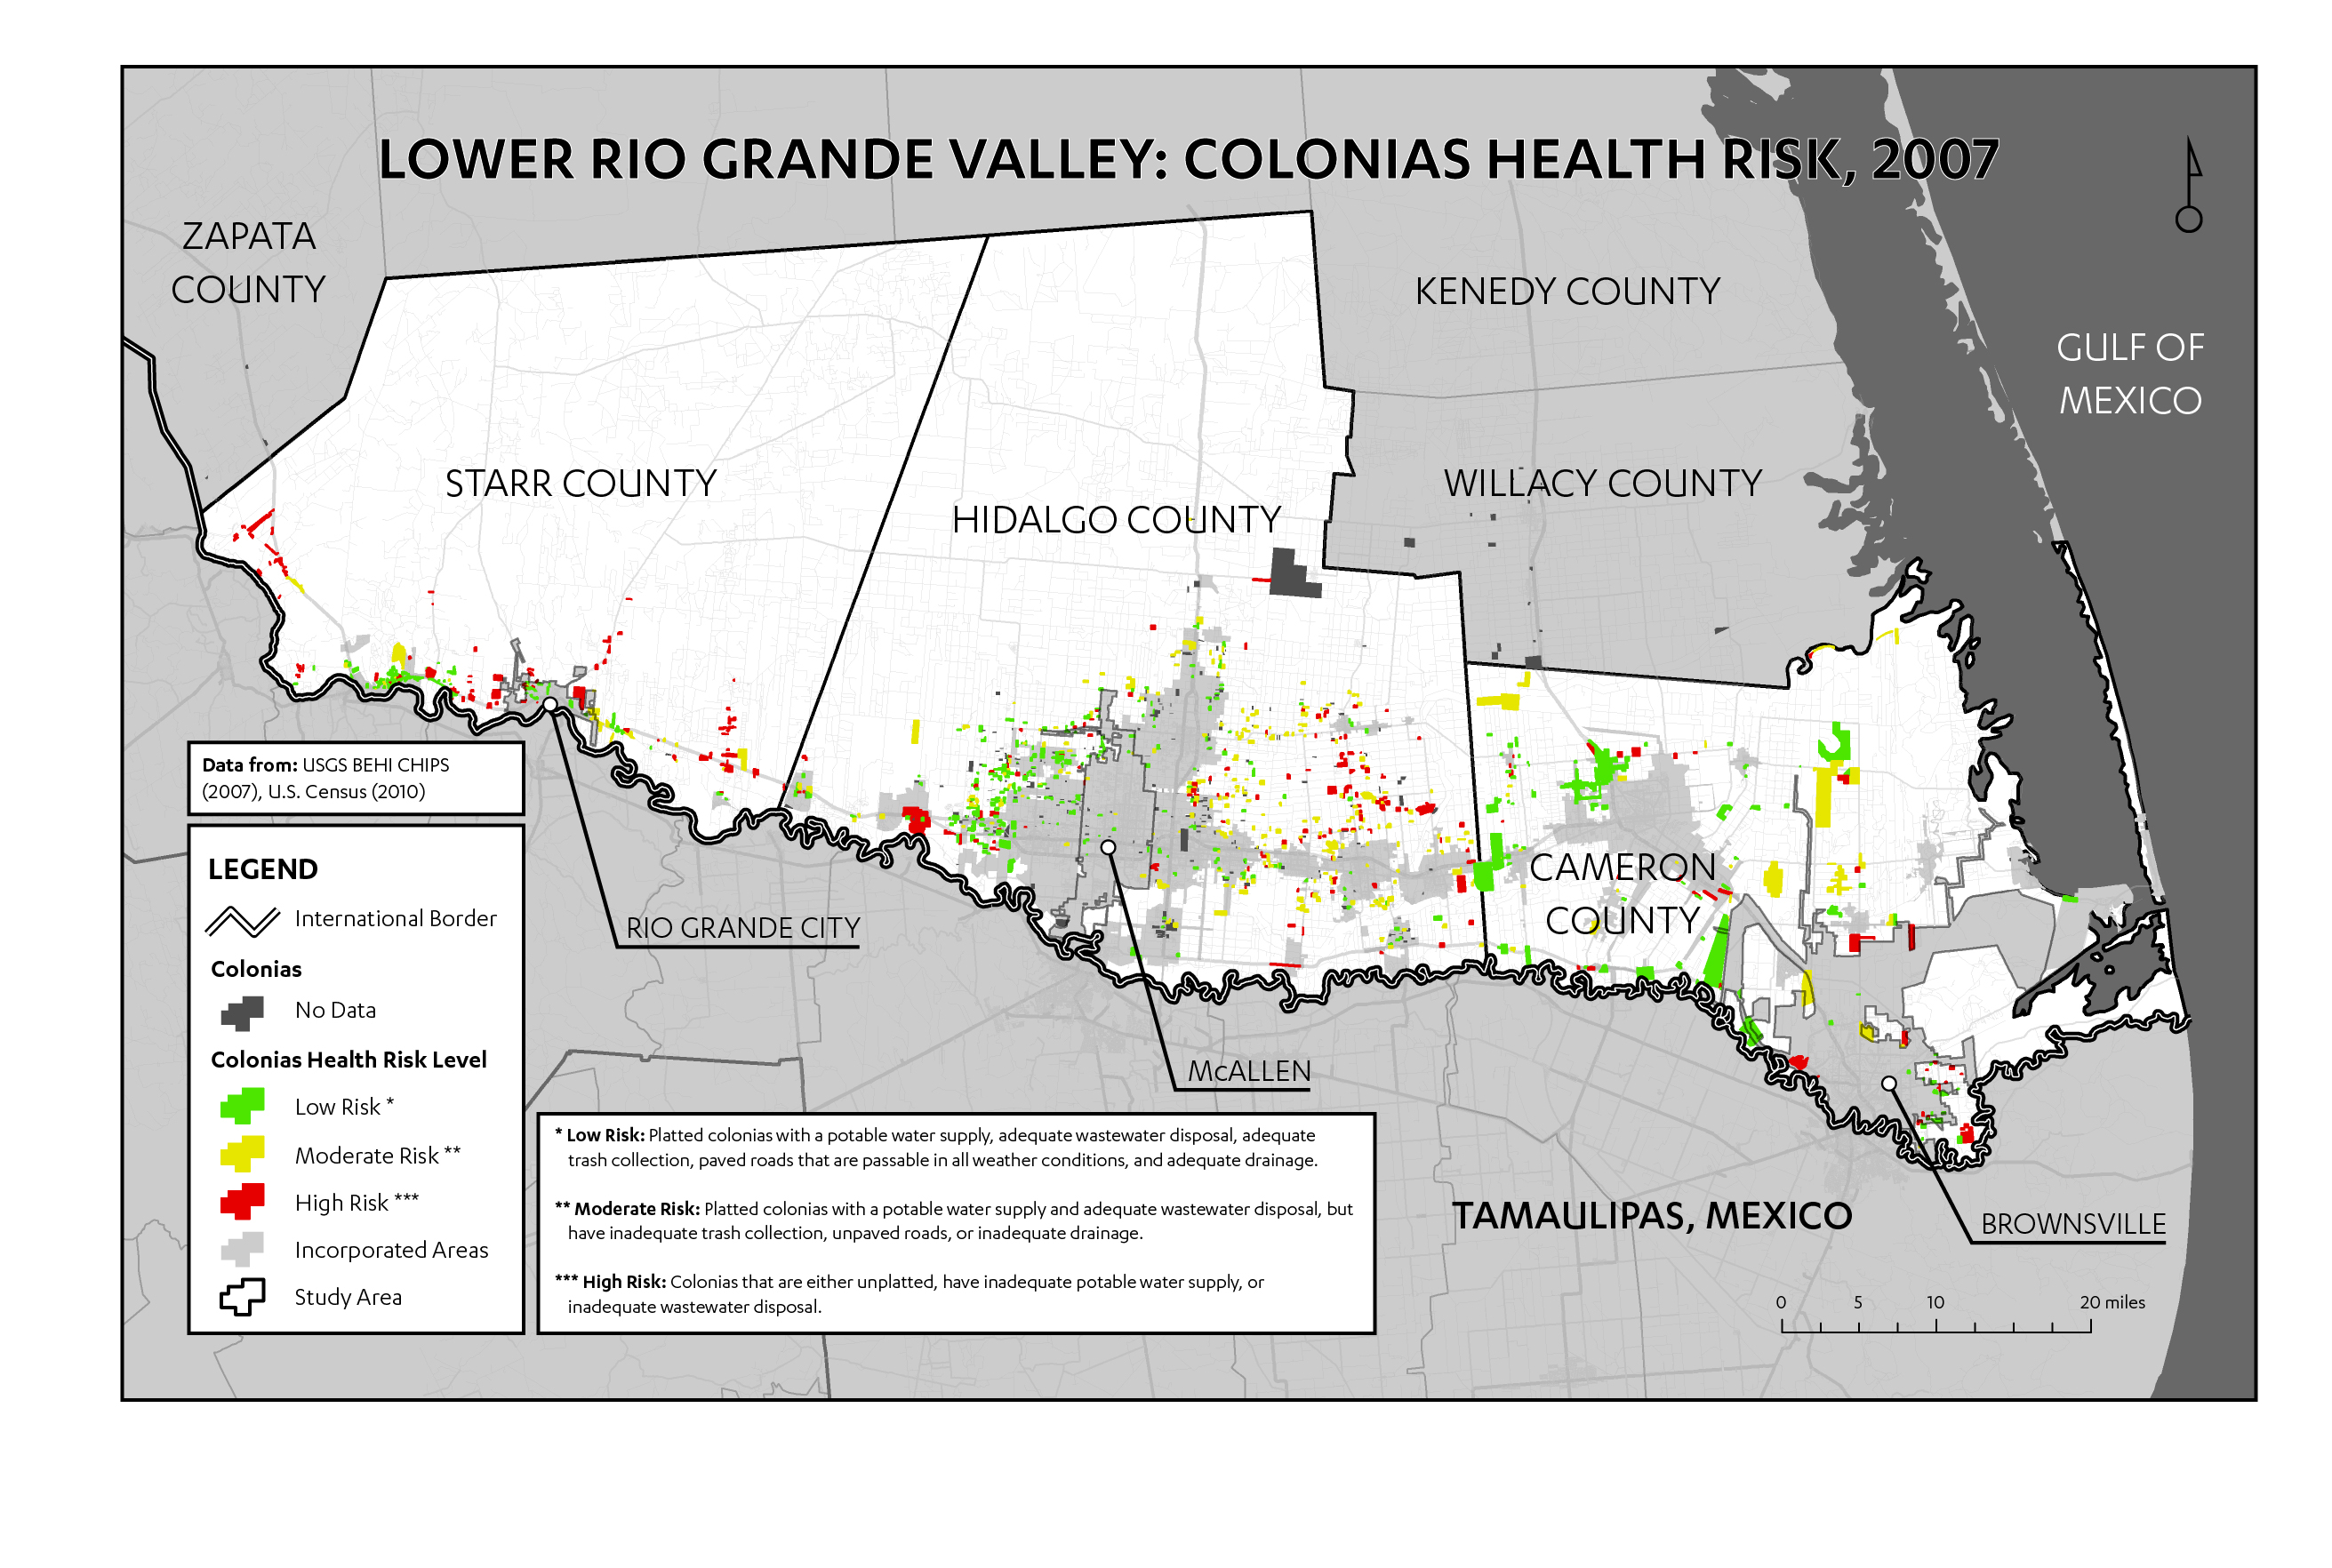
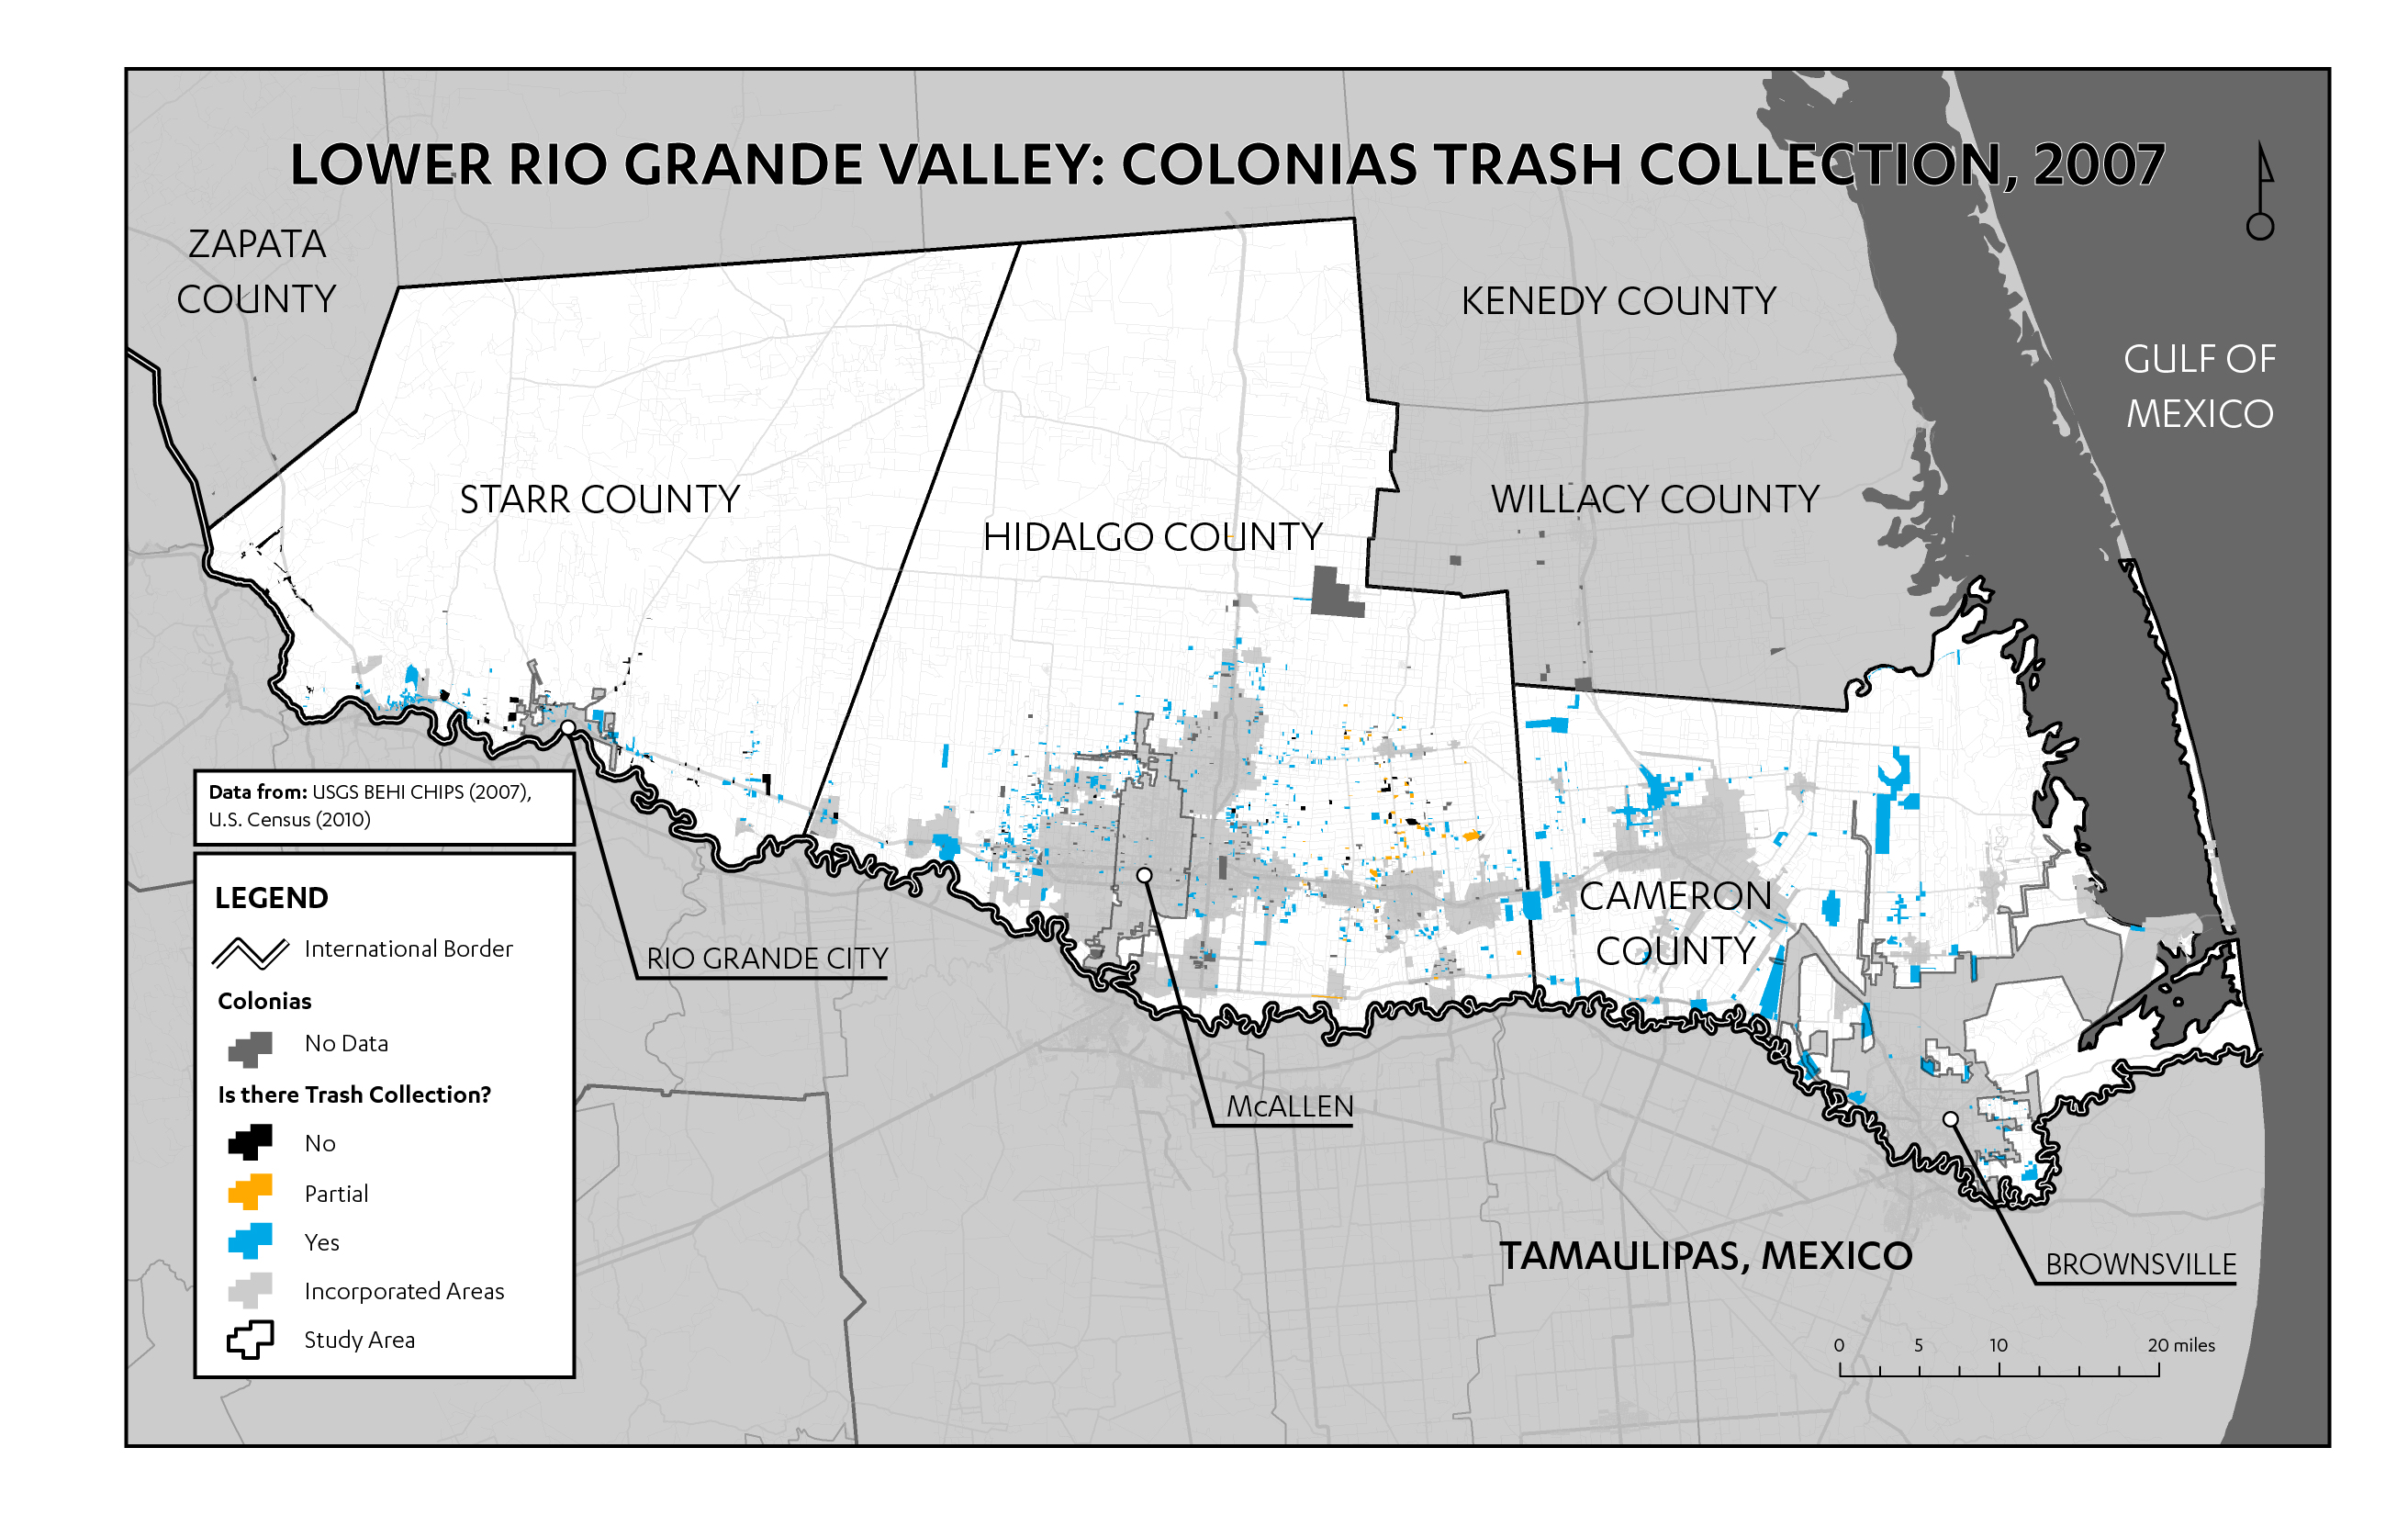
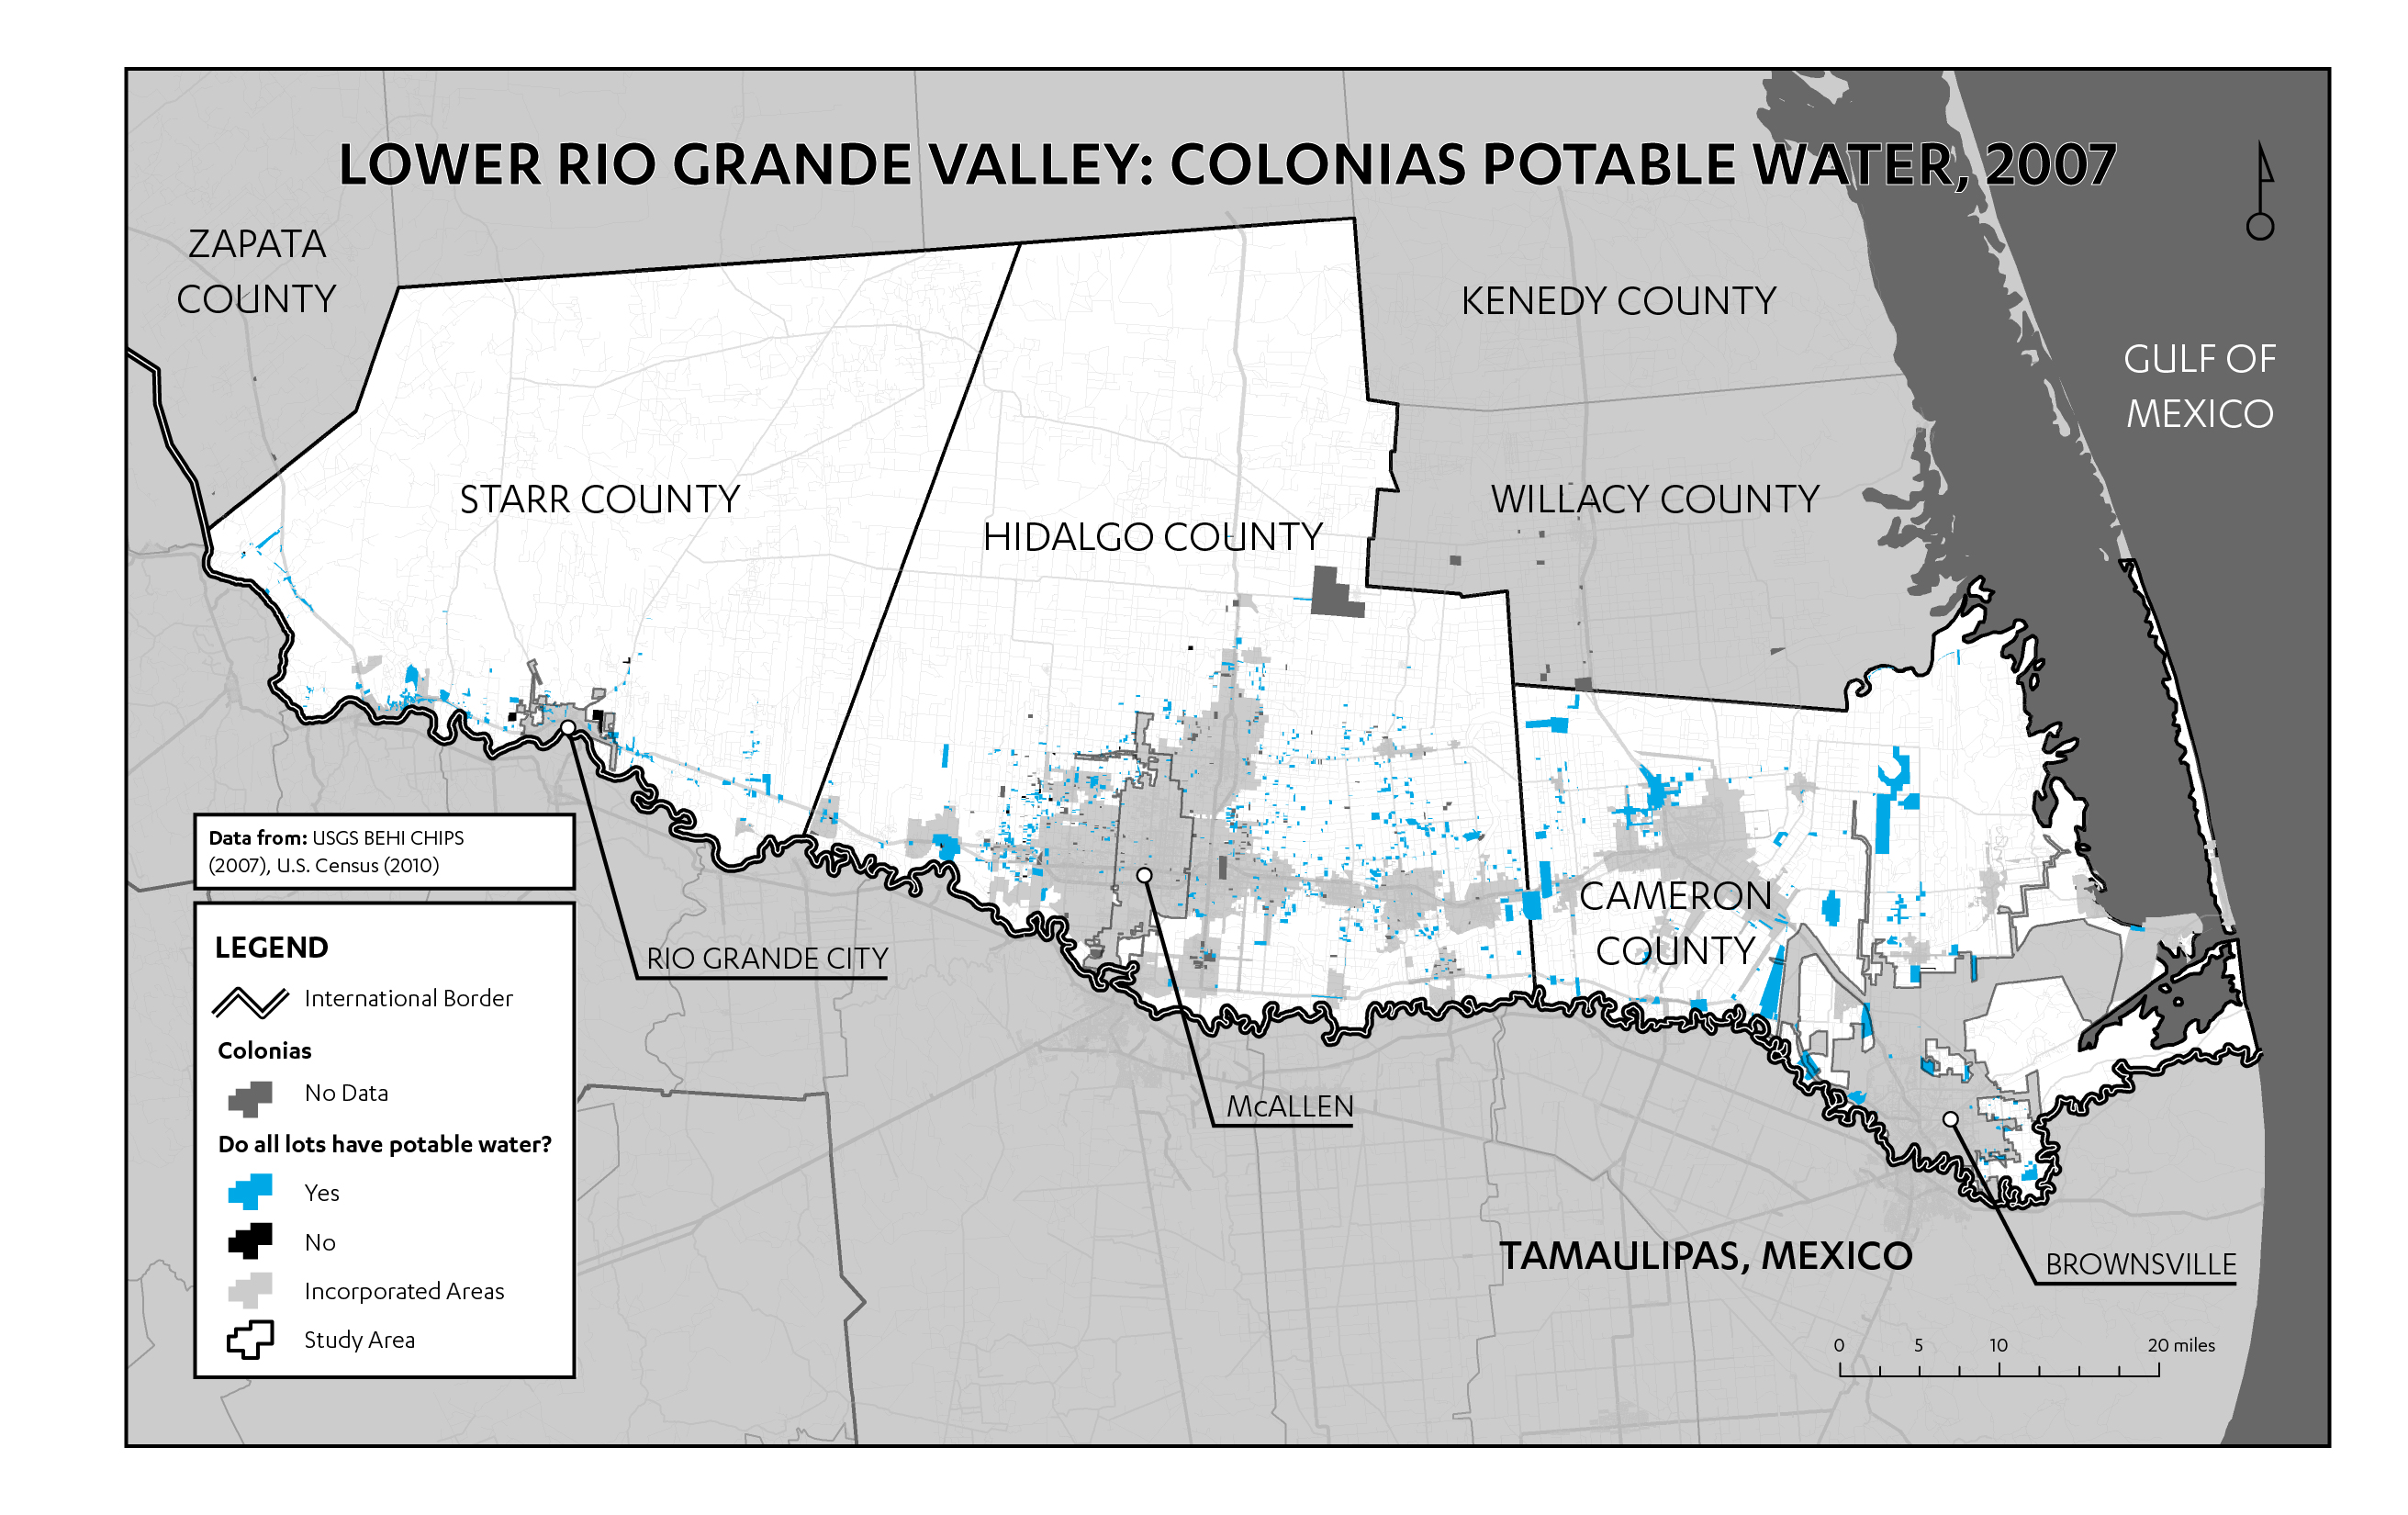
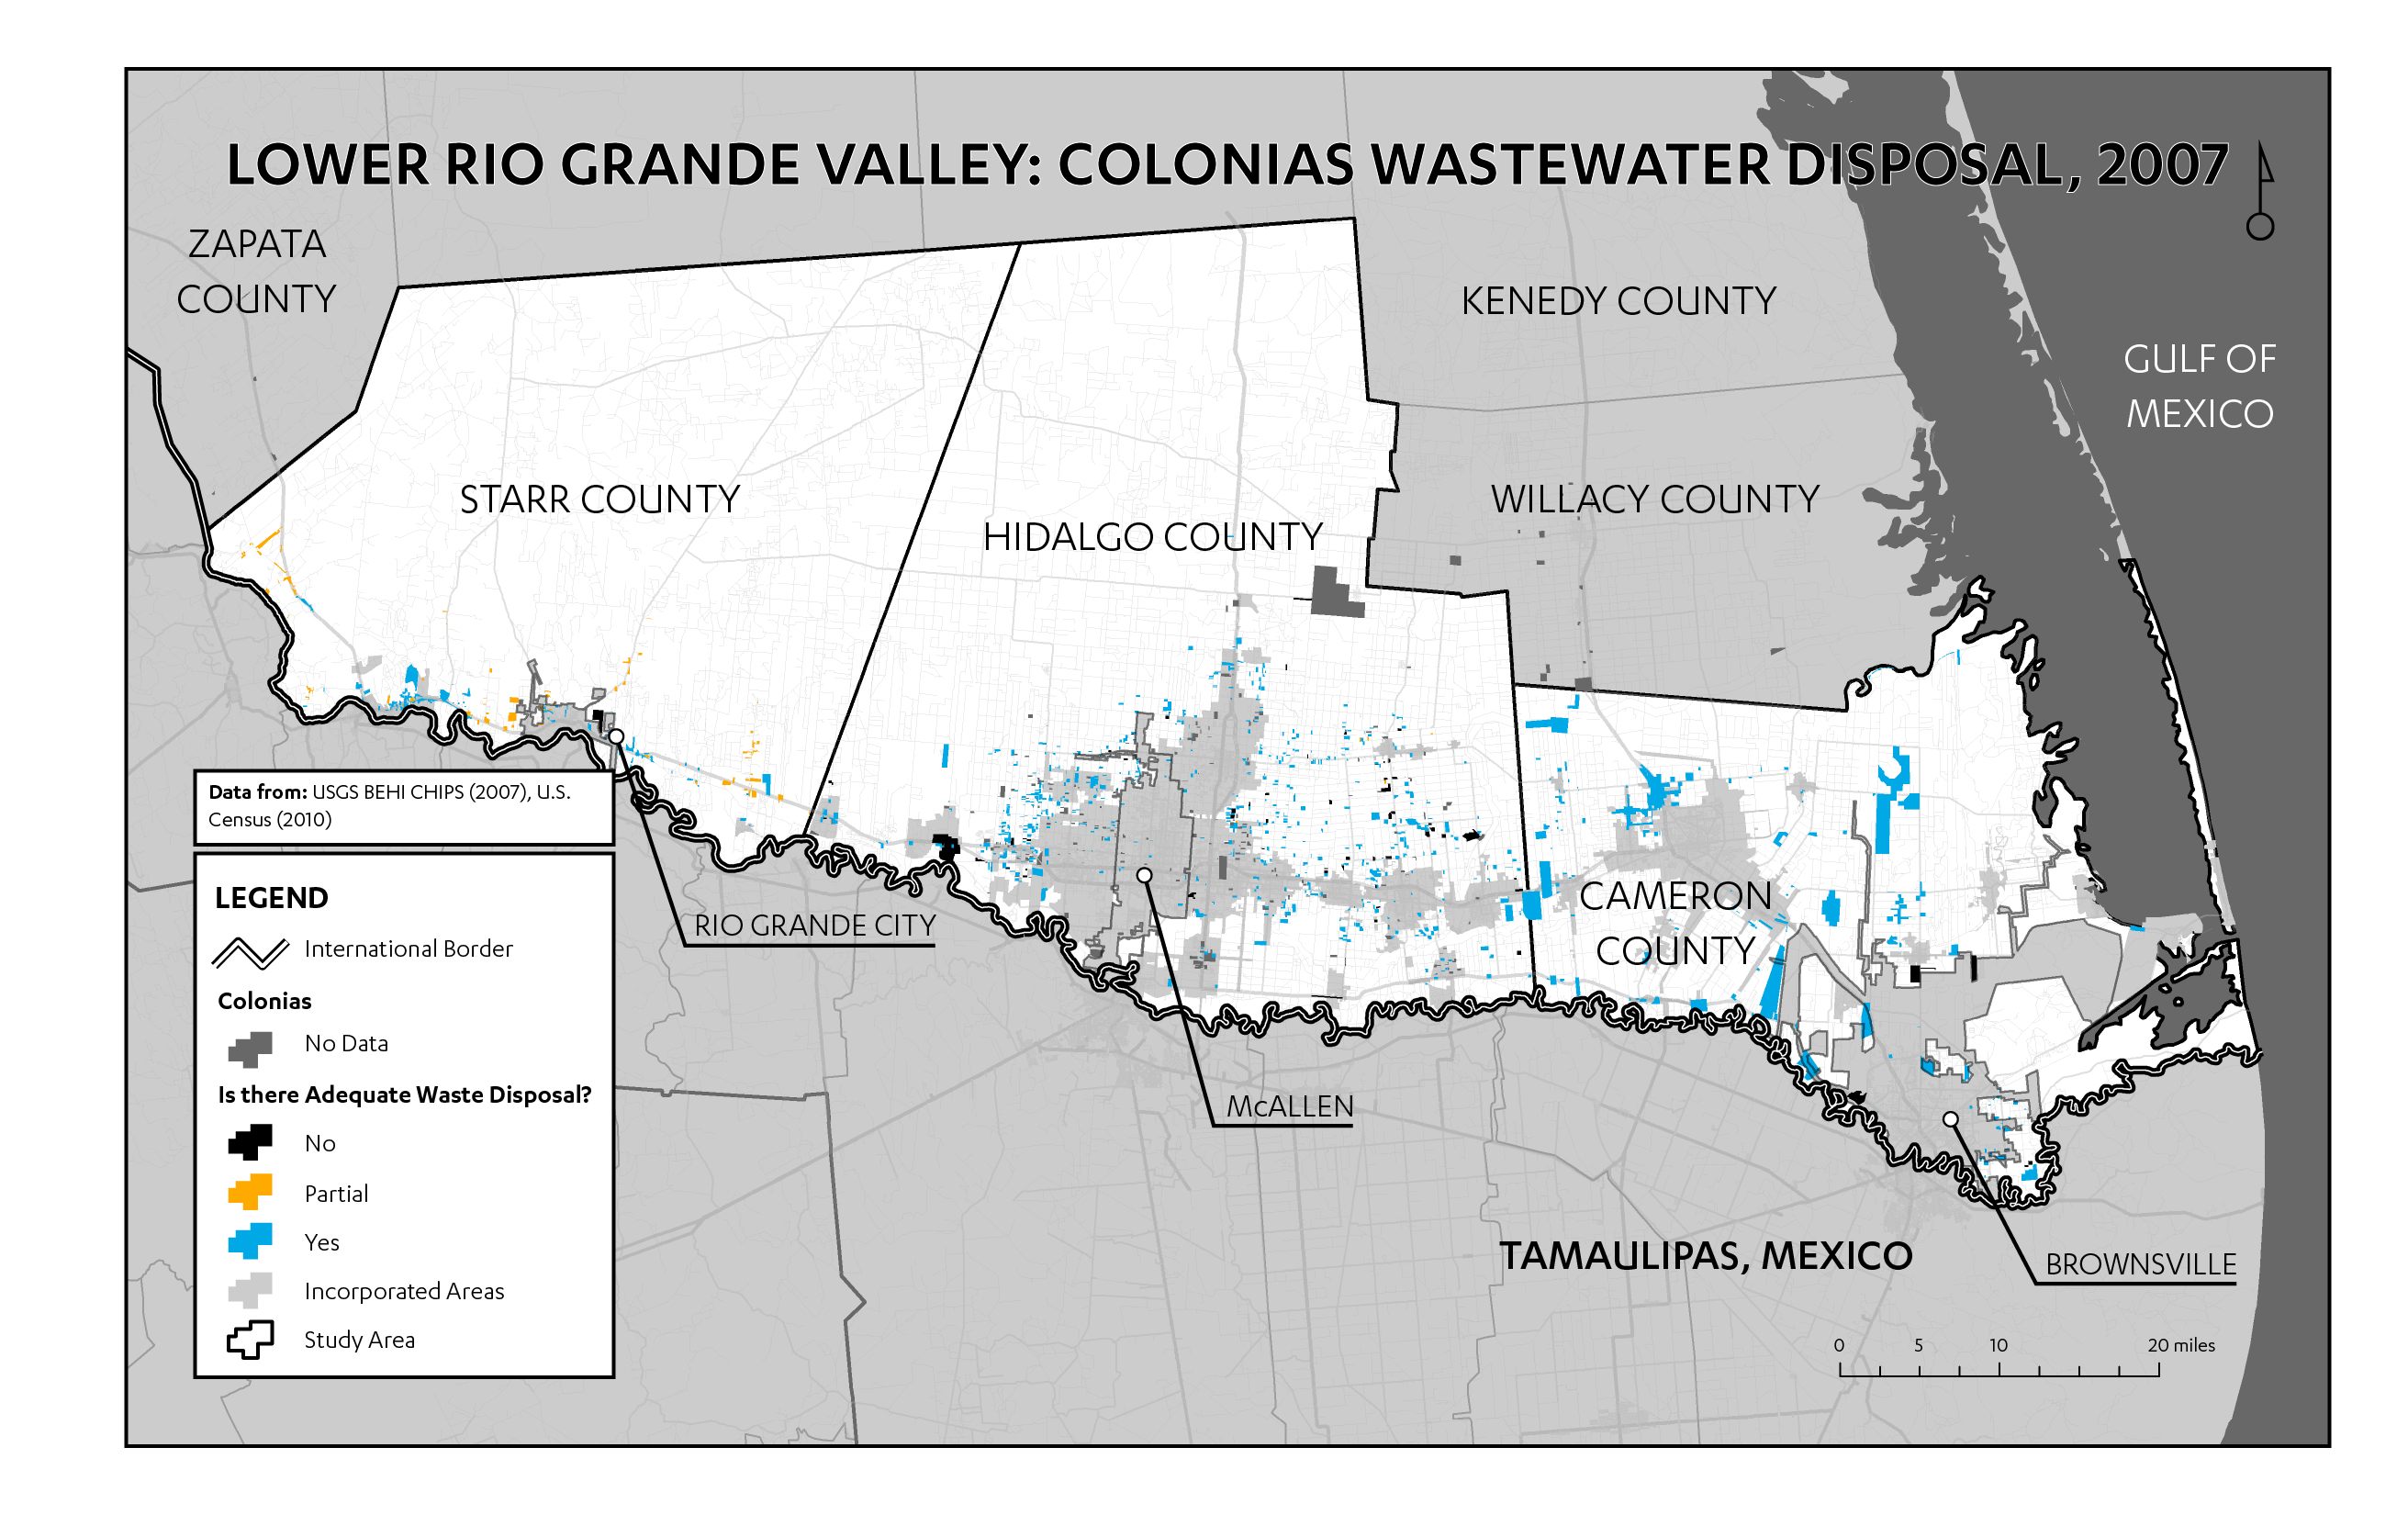
The CHIPS data provide another useful metric of environmental impact in the colonias: public health risk. CHIPS categorizes colonias health risk along a three-category scale: low, moderate, and high, delineated in terms of their access to several basic services (Figure 6). This classification, while coarse, illustrates a useful point: the absence of these basic services has a compounding effect on the susceptibility of residents to diseases, often those typically associated with the third world, such as cholera and dengue fever (Williams 2001-2002: 709-711). Figures 7, 8, and 9 illustrate trends in the distribution of three of the services measured in “health risk”: trash collection, potable water, and wastewater disposal. While the CHIPS data suggest that the majority of colonias receive basic services, preliminary interviews with regional nonprofit leaders contradict this notion. For instance, a coalition of Hidalgo County nonprofits is currently lobbying for trash collection in colonias, a service that, according to CHIPS, the majority of colonias already have (Figure 10). While the nonprofits may be exaggerating the need for trash collection, such discrepancies, as well as the potential miscounts, have not been empirically examined. Therefore, it is difficult to determine whether CHIPS, the nonprofits, or both are incorrectly identifying the problem.
Shortcomings of CHIPS Data
These observations reveal several shortcomings of CHIPS. First, CHIPS is meant to provide a measure of environmental health, but it does not discuss built environment issues. Nonprofit leaders noted a divide between their own focus on housing and the government’s focus on utilities, a divide that may reflect a view of housing as private and utilities as public. This public/private view results in a dearth of public data on the built environment. However, built environment characteristics affect health outcomes and constitute a core component of environmental health (Northridge, Sclar, and Biswas 2003; Srinivasan, O’Fallon, and Dearry 2003). In response to this shortcoming, I suggest that CHIPS data be updated yet again for the 2010s to include new metrics surveying housing quality and the built environment.
Second, undercounts of colonias population and settlement (outlined above) have real effects. For instance, the U.S. Census has consistently undercounted population in the colonias, which has resulted in inadequate funding and representation for poor, high-colonias counties (MacLaggan 2013). The federal definition of “colonia” leads to similar miscounts in CHIPS, which masks the need for basic services funding and impugns the accuracy of the data set. To remedy this issue, the federal definition of “colonia” should be revisited, especially given the number of omitted settlements and the possibility that the omitted colonias have the greatest need. This conclusion is not inconsistent with existing literature, as others have made similar policy recommendations (Mukhija and Monkkonen 2007). Our knowledge about colonias comes from outdated data sets and definitions; thus, we need rigorous research that examines the conditions and needs of today’s contemporary colonias.

References
- Applebome, Peter. 1989. “At Texas Border, Hopes for Sewers and Water.” The New York Times, January 3.
- Arizmendi, Lydia, David Arizmendi, and Angela Donelson. 2010. “Colonias Housing and Community Development.” In The Colonias Reader: Economy, Housing, and Public Health in U.S.-Mexico Border Colonias, edited by Angela J. Donelson and Adrian X. Esparza, 87-100. Tucson: The University of Arizona Press.
- CHIPS (Colonias Health, Infrastructure, and Platting Status). 2007. http://borderhealth.cr.usgs.gov/datalayers_nojava.html.
- Donelson, Angela. 2004. “The Role of NGOs and NGO Networks in Meeting the Needs of US Colonias.” Community Development Journal 39 (4): 332-344.
- HAC (Housing Assistance Council). 2005. A Guide to Nonprofit Housing Organizations Serving the Colonias. Washington, DC: Housing Assistance Council.
- ———. 2013. Rural Research Report: Housing in the Border Colonias. Washington, DC: Housing Assistance Council.
- HUD (U.S. Department of Housing and Urban Development). 2014. “Community Development Block Grant: COLONIAS.” Washington, DC: U.S. Department of Housing and Urban Development. http://portal.hud.gov/hudportal/HUD?ENTITY=/program_offices/comm_planning/communitydevelopment/programs/colonias.
- MacLaggan, Corrie. 2013. “Hidalgo County Fights to Ensure Census Counts Everyone.” The Texas Tribune, September 6.
- Mukhija, Vinit, and Paavo Monkkonen. 2007. “What’s in a Name? A Critique of ‘Colonias’ in the United States.” International Journal of Urban and Regional Planning 31 (2): 475-488.
- Northridge, Mary E., Elliot D. Sclar, and Padmini Biswas. 2003. “Sorting Out the Connections between the Built Environment and Health: A Conceptual Framework for Navigating Pathways and Planning Healthy Cities.” Journal of Urban Health 80 (4): 556-568.
- Srinivasan, Shobha, Liam R. O’Fallon, and Allen Dearry. 2003. “Creating Healthy Communities, Healthy Homes, Healthy People: Initiating a Research Agenda on the Built Environment and Public Health.” Public Health 93 (9): 1446-1450.
- Texas Secretary of State. 2014. “Directory of Colonias Located in Texas.” http://www.sos.state.tx.us/border/colonias/reg-colonias/index.shtml.
- USGS BEHI (U. S. Geological Service U.S.-Mexico Border Environmental Health Initiative). 2011. “Data Download.” http://borderhealth.cr.usgs.gov/datalayers.html.
- Ward, Peter M. 1999. Colonias and Public Policy in Texas and Mexico: Urbanization by Stealth. Austin: University of Texas Press.
- Williams, Roderick R. 2001-2002. “Cardboard to Concrete: Reconstructing the Texas Colonias Threshold.” Hastings Law Journal 53: 705-732.


